Cyxtera Investor Presentation Deck slide image

Cyxtera Investor Presentation Deck

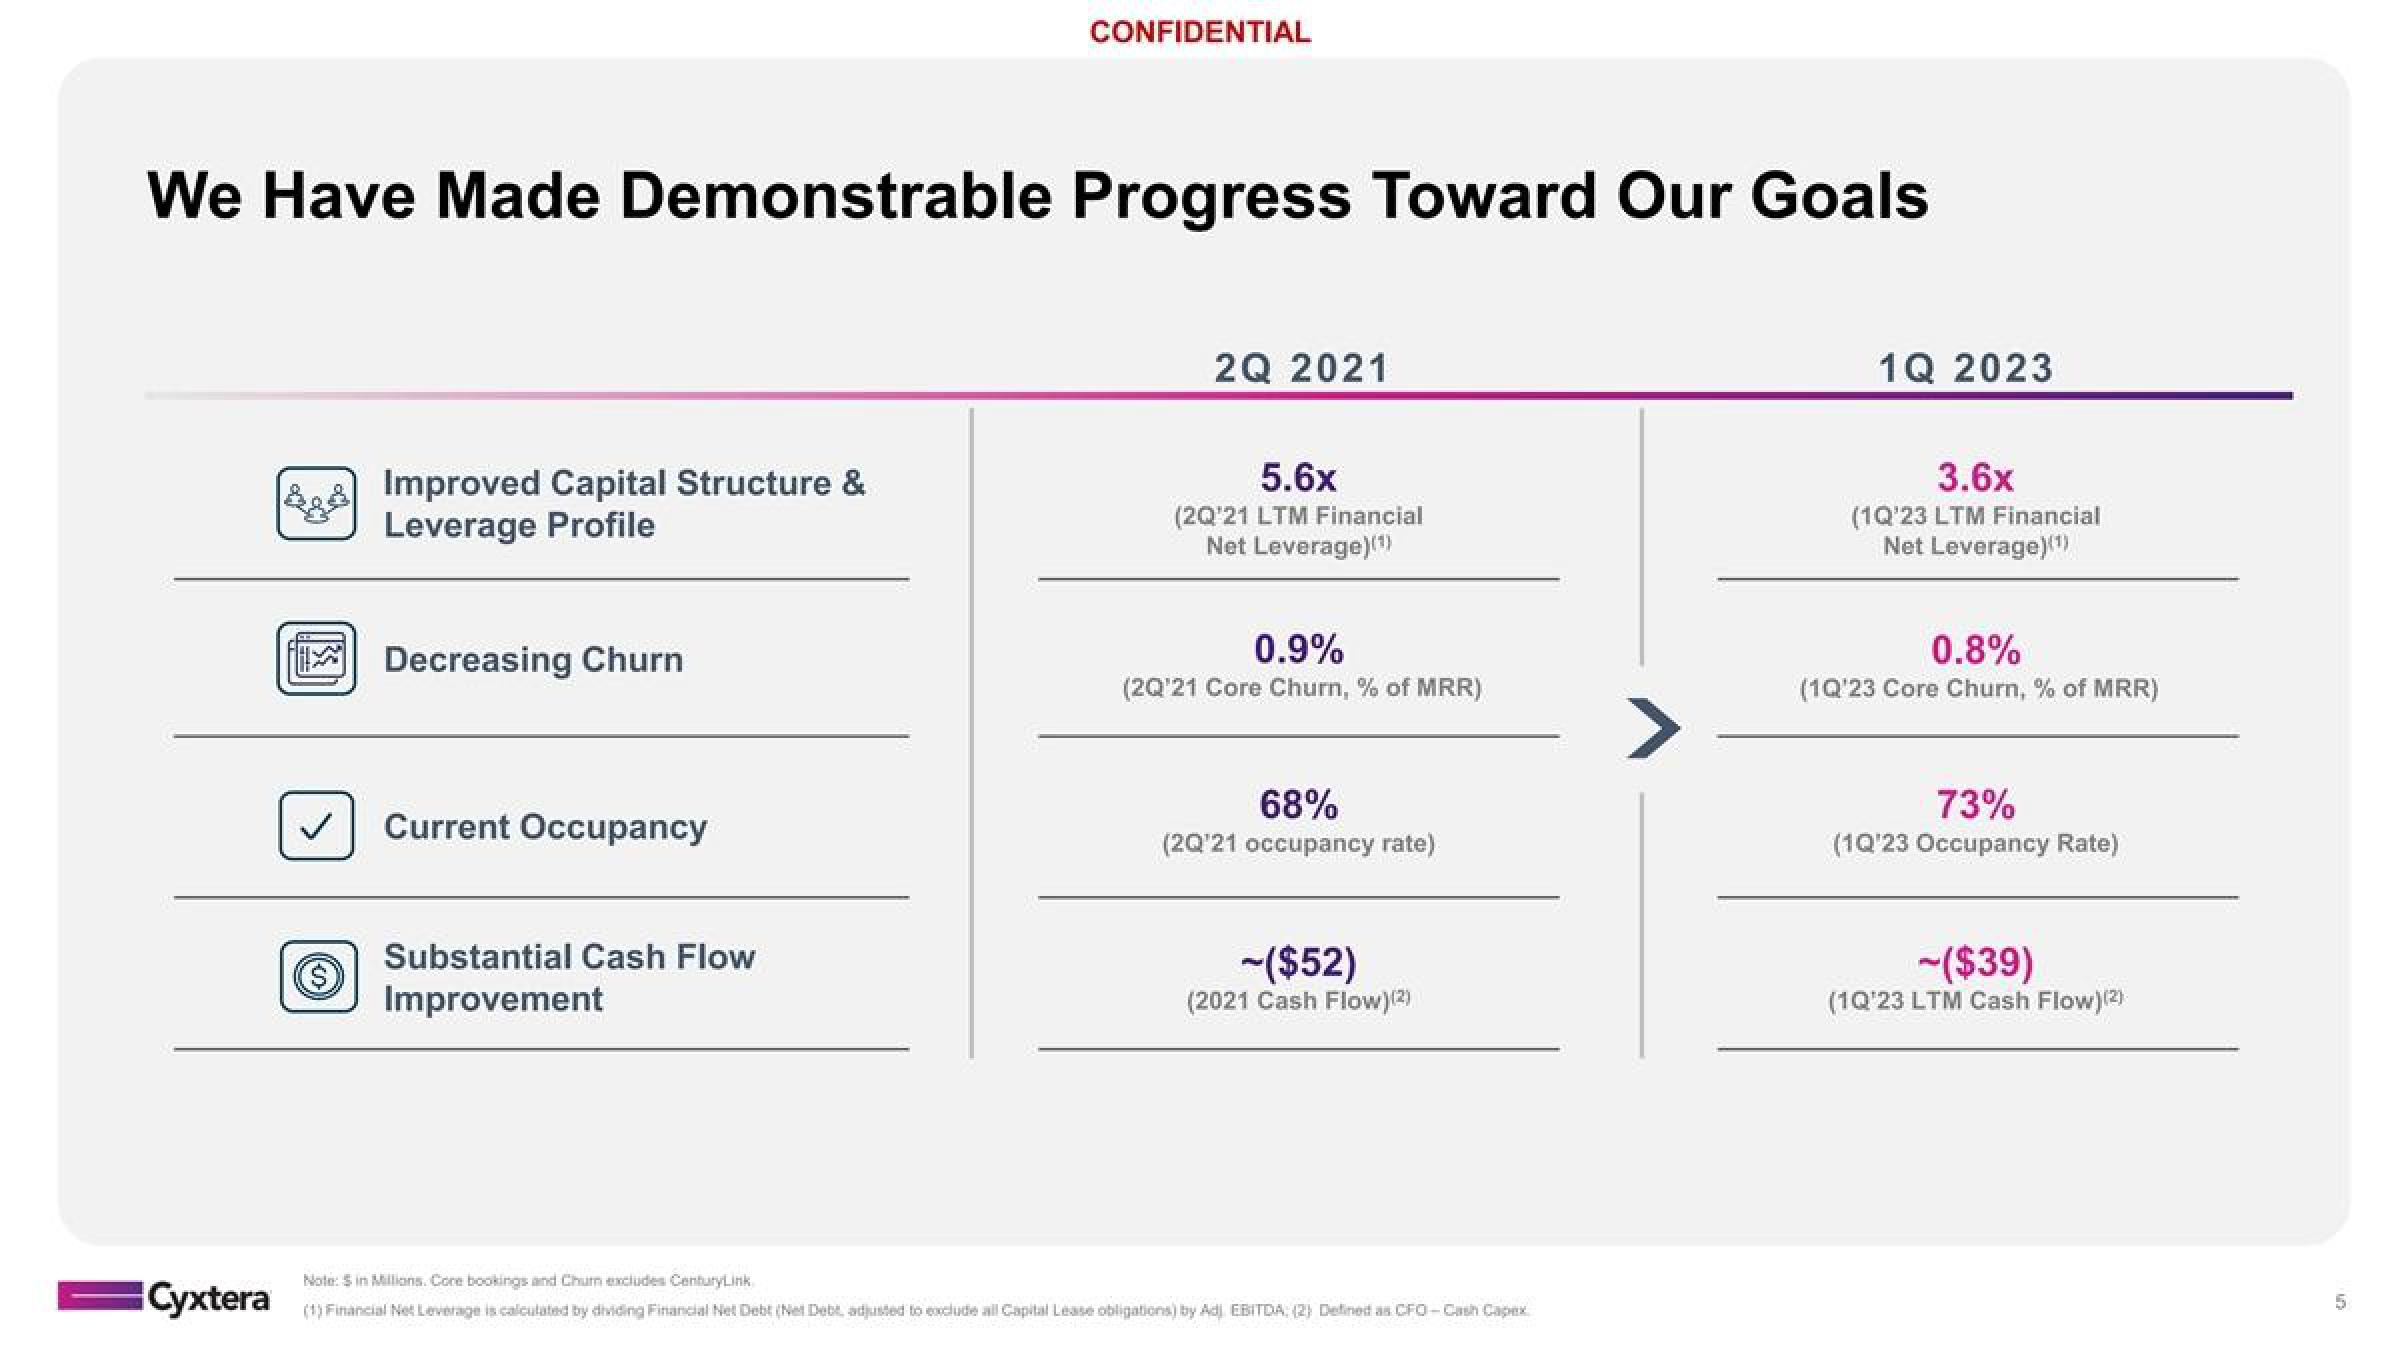
We Have Made Demonstrable Progress Toward Our Goals Cyxtera Åå S Improved Capital Structure & Leverage Profile Decreasing Churn Current Occupancy CONFIDENTIAL Substantial Cash Flow Improvement 2Q 2021 5.6x (2Q'21 LTM Financial Net Leverage)(¹) 0.9% (2Q'21 Core Churn, % of MRR) 68% (2Q'21 occupancy rate) -($52) (2021 Cash Flow) (2) Note: $ in Millions. Core bookings and Churn excludes CenturyLink (1) Financial Net Leverage is calculated by dividing Financial Net Debt (Net Debt, adjusted to exclude all Capital Lease obligations) by Adi EBITDA (2) Defined as CFO-Cash Capex 1Q 2023 3.6x (1Q'23 LTM Financial Net Leverage)(¹) 0.8% (1Q'23 Core Churn, % of MRR) 73% (1Q'23 Occupancy Rate) -($39) (1Q'23 LTM Cash Flow)(2)
View entire presentation