Anixter International Inc. Financial Statement Analysis
ANIXTER INTERNATIONAL INC.
ITEM 7. MANAGEMENT'S DISCUSSION AND ANALYSIS OF FINANCIAL CONDITION AND RESULTS OF
OPERATIONS.
Executive Overview
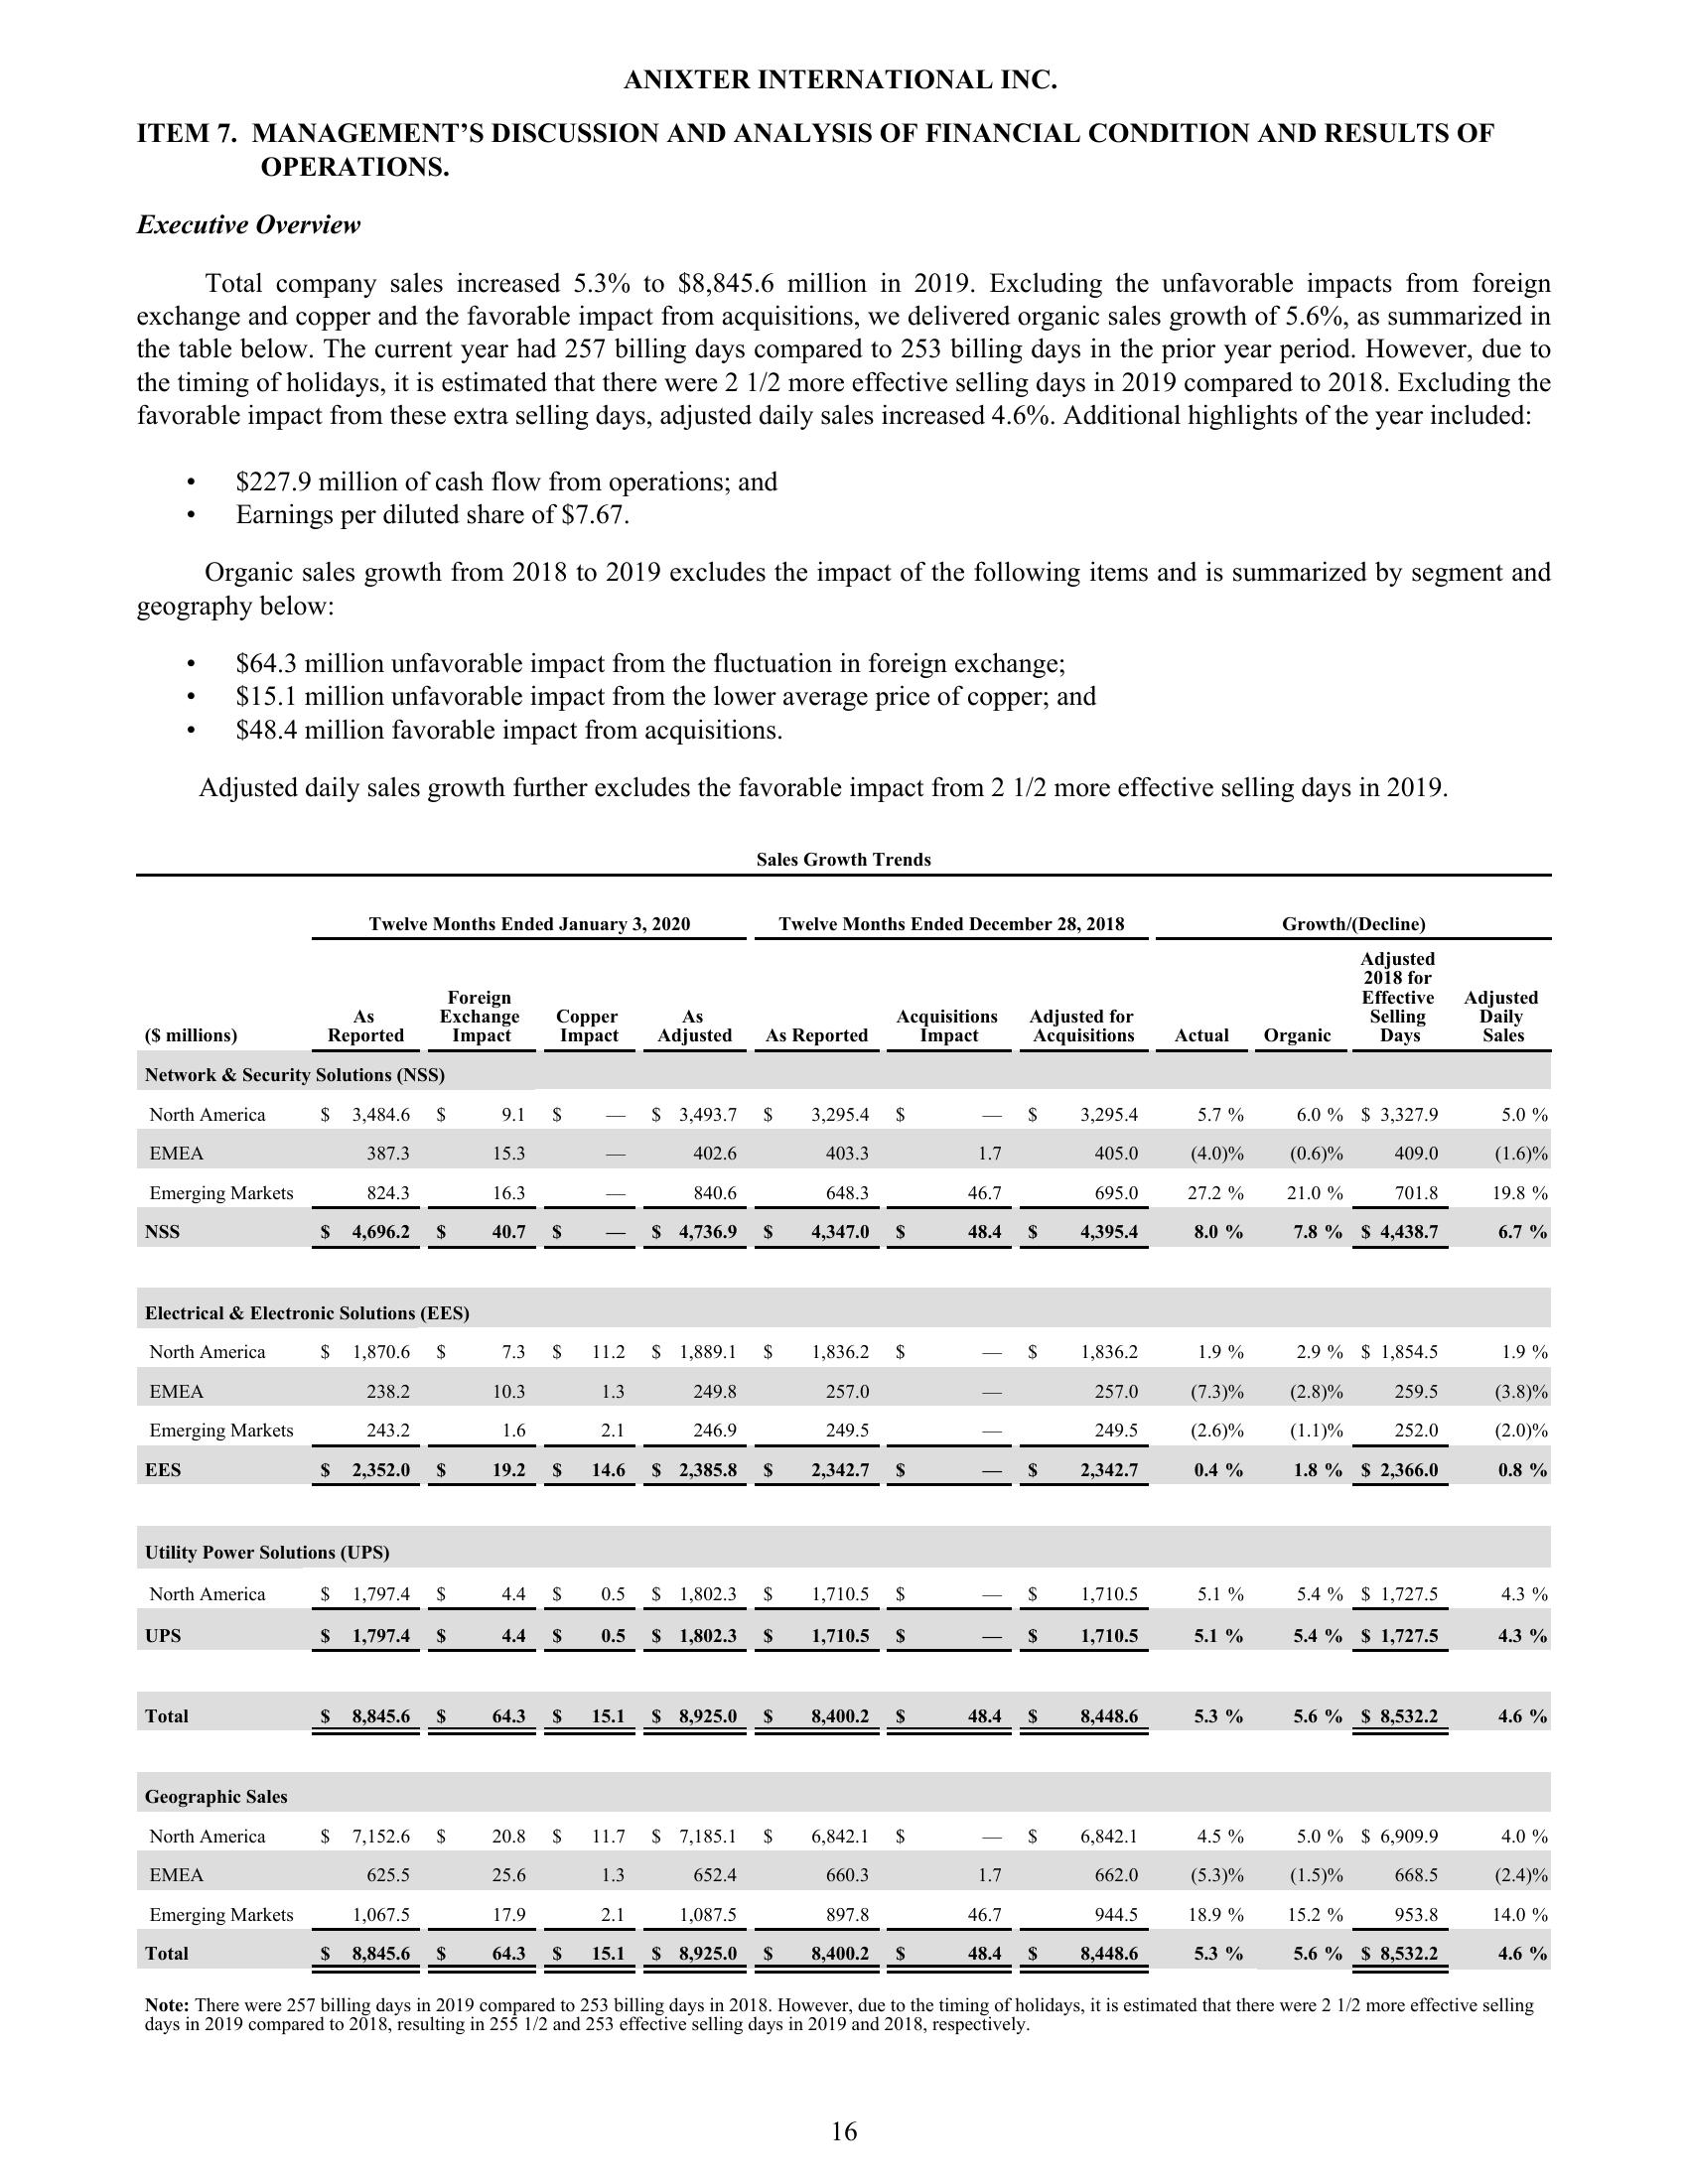
Total company sales increased 5.3% to $8,845.6 million in 2019. Excluding the unfavorable impacts from foreign
exchange and copper and the favorable impact from acquisitions, we delivered organic sales growth of 5.6%, as summarized in
the table below. The current year had 257 billing days compared to 253 billing days in the prior year period. However, due to
the timing of holidays, it is estimated that there were 2 1/2 more effective selling days in 2019 compared to 2018. Excluding the
favorable impact from these extra selling days, adjusted daily sales increased 4.6%. Additional highlights of the
year included:
•
$227.9 million of cash flow from operations; and
Earnings per diluted share of $7.67.
Organic sales growth from 2018 to 2019 excludes the impact of the following items and is summarized by segment and
geography below:
$64.3 million unfavorable impact from the fluctuation in foreign exchange;
$15.1 million unfavorable impact from the lower average price of copper; and
$48.4 million favorable impact from acquisitions.
Adjusted daily sales growth further excludes the favorable impact from 2 1/2 more effective selling days in 2019.
Sales Growth Trends
Twelve Months Ended January 3, 2020
Twelve Months Ended December 28, 2018
Growth/(Decline)
Adjusted
2018 for
($ millions)
As
Reported
Foreign
Exchange Copper
Impact Impact
Effective
As
Adjusted
As Reported
Acquisitions
Impact
Adjusted for
Acquisitions
Selling
Actual
Organic
Days
Adjusted
Daily
Sales
Network & Security Solutions (NSS)
North America
$ 3,484.6 $
9.1
$
EMEA
387.3
15.3
$ 3,493.7
402.6
$
3,295.4 $
3,295.4
403.3
1.7
405.0
5.7%
(4.0)%
6.0 % $ 3,327.9
5.0 %
Emerging Markets
824.3
16.3
840.6
648.3
46.7
695.0
NSS
$ 4,696.2 $
40.7
$ 4,736.9 $
4,347.0 $
48.4 $
4,395.4
27.2%
8.0 %
(0.6)%
21.0 %
409.0
(1.6)%
701.8
7.8 %
$ 4,438.7
19.8 %
6.7 %
Electrical & Electronic Solutions (EES)
North America
$
EMEA
1,870.6
238.2
$
7.3
$
11.2
$ 1,889.1 $
1,836.2 $
1,836.2
1.9 %
2.9 % $ 1,854.5
1.9%
10.3
1.3
249.8
257.0
257.0
(7.3)%
(2.8)%
259.5
(3.8)%
Emerging Markets
243.2
1.6
2.1
246.9
249.5
249.5
(2.6)%
(1.1)%
252.0
(2.0)%
EES
2,352.0 $
19.2 $
14.6
$ 2,385.8 $
2,342.7 $
2,342.7
0.4 %
1.8 %
$ 2,366.0
0.8 %
Utility Power Solutions (UPS)
North America
UPS
$ 1,797.4 $
$ 1,797.4 $
4.4 S
0.5
4.4 $
0.5
$ 1,802.3 $
$ 1,802.3 $
1,710.5 $
1,710.5 S
$
1,710.5
1.710.5
5.1 %
5.1 %
5.4 % $ 1,727.5
5.4 % $ 1,727.5
4.3 %
4.3 %
Total
$ 8,845.6 $
64.3
S 15.1
$ 8,925.0 $
8,400.2 S
48.4
S
8,448.6
5.3 %
5.6 % $ 8,532.2
4.6 %
Geographic Sales
North America
EMEA
$ 7,152.6 $
20.8
625.5
25.6
1.3
Emerging Markets
1,067.5
17.9
2.1
11.7 $ 7,185.1 $
652.4
1,087.5
6,842.1 $
6,842.1
660.3
1.7
662.0
897.8
46.7
Total
$ 8,845.6 $
64.3 $
15.1
$ 8,925.0 $ 8,400.2
S
48.4
$
944.5
8,448.6
4.5 %
(5.3)%
18.9 %
5.3 %
5.0 % $ 6,909.9
(1.5)%
15.2%
5.6 % $ 8,532.2
4.0 %
668.5
(2.4)%
953.8
14.0%
4.6 %
Note: There were 257 billing days in 2019 compared to 253 billing days in 2018. However, due to the timing of holidays, it is estimated that there were 2 1/2 more effective selling
days in 2019 compared to 2018, resulting in 255 1/2 and 253 effective selling days in 2019 and 2018, respectively.
16View entire presentation