Kinnevik Results Presentation Deck
Intro
Net Asset Value
CONSUMER FINANCE
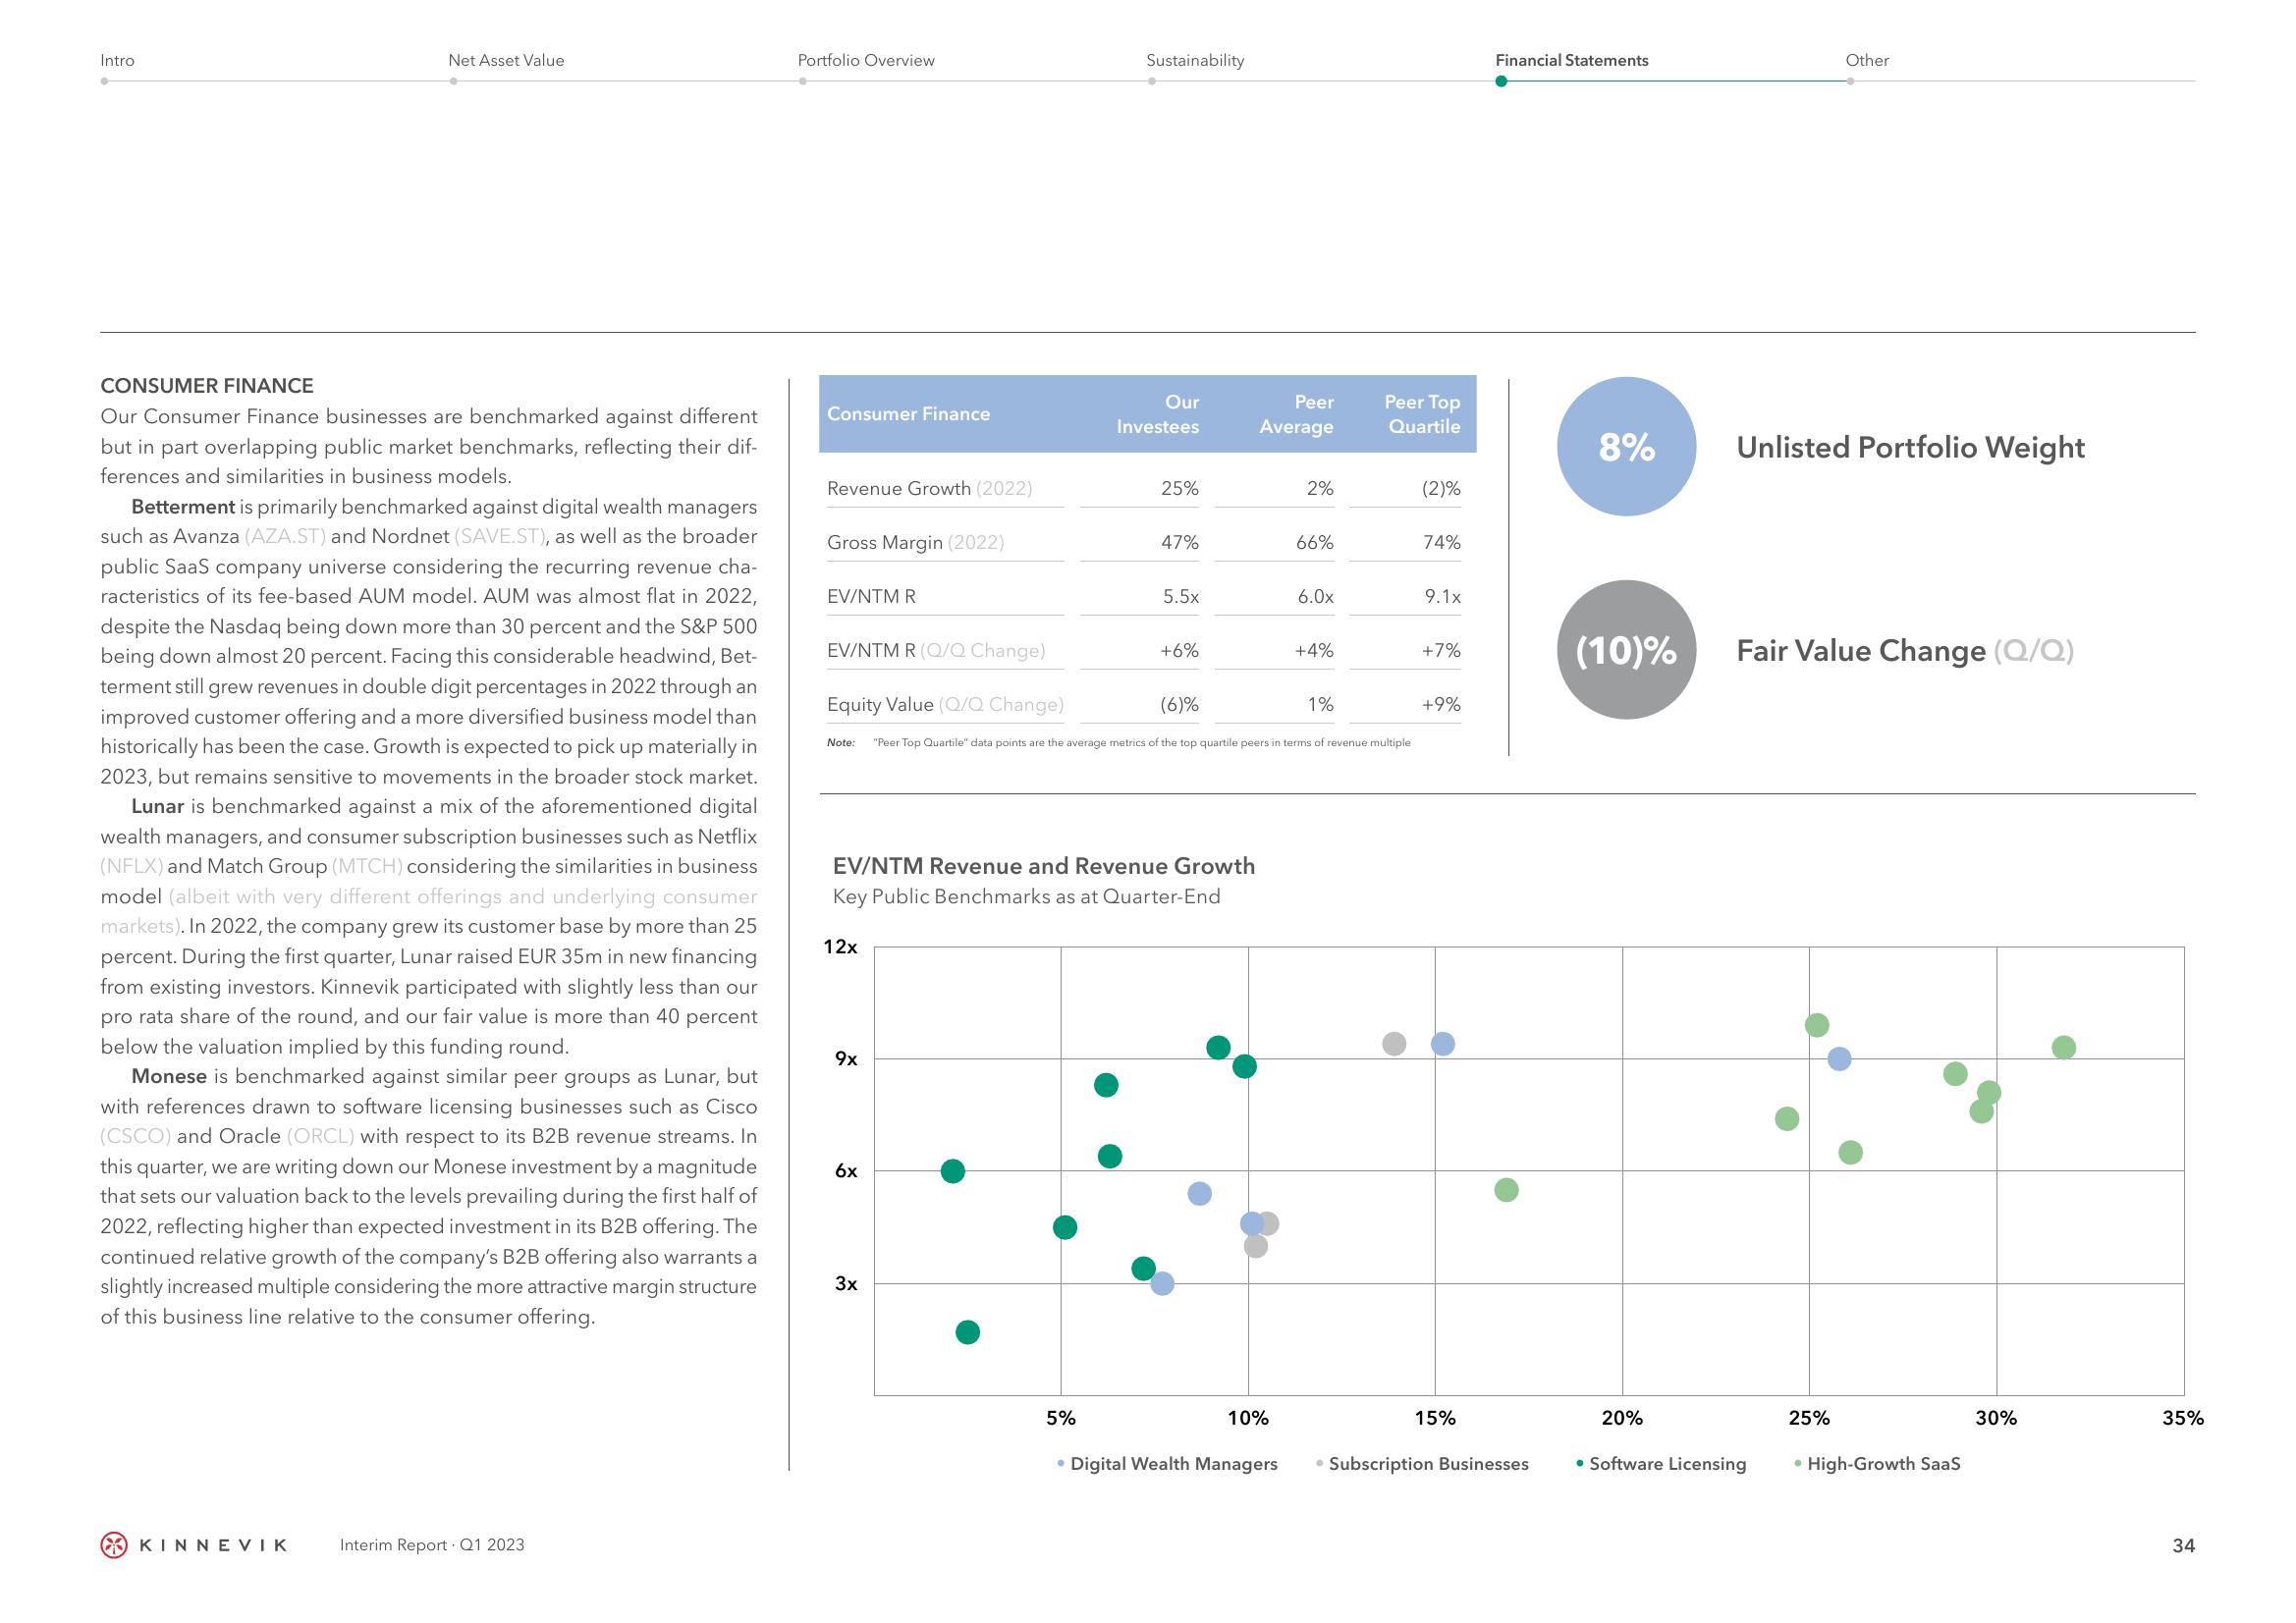
Our Consumer Finance businesses are benchmarked against different
but in part overlapping public market benchmarks, reflecting their dif-
ferences and similarities in business models.
Betterment is primarily benchmarked against digital wealth managers
such as Avanza (AZA.ST) and Nordnet (SAVE.ST), as well as the broader
public SaaS company universe considering the recurring revenue cha-
racteristics of its fee-based AUM model. AUM was almost flat in 2022,
despite the Nasdaq being down more than 30 percent and the S&P 500
being down almost 20 percent. Facing this considerable headwind, Bet-
terment still grew revenues in double digit percentages in 2022 through an
improved customer offering and a more diversified business model than
historically has been the case. Growth is expected to pick up materially in
2023, but remains sensitive to movements in the broader stock market.
Lunar is benchmarked against a mix of the aforementioned digital
wealth managers, and consumer subscription businesses such as Netflix
(NFLX) and Match Group (MTCH) considering the similarities in business
model (albeit with very different offerings and underlying consumer
markets). In 2022, the company grew its customer base by more than 25
percent. During the first quarter, Lunar raised EUR 35m in new financing
from existing investors. Kinnevik participated with slightly less than our
pro rata share of the round, and our fair value is more than 40 percent
below the valuation implied by this funding round.
Monese is benchmarked against similar peer groups as Lunar, but
with references drawn to software licensing businesses such as Cisco
(CSCO) and Oracle (ORCL) with respect to its B2B revenue streams. In
this quarter, we are writing down our Monese investment by a magnitude
that sets our valuation back to the levels prevailing during the first half of
2022, reflecting higher than expected investment in its B2B offering. The
continued relative growth of the company's B2B offering also warrants a
slightly increased multiple considering the more attractive margin structure
of this business line relative to the consumer offering.
KINNEVIK
Interim Report Q1 2023
Portfolio Overview
Consumer Finance
Revenue Growth (2022)
Gross Margin (2022)
EV/NTM R
EV/NTM R (Q/Q Change)
Equity Value (Q/Q Change)
Note:
12x
9x
6x
3x
Sustainability
Our
Investees
5%
25%
47%
EV/NTM Revenue and Revenue Growth
Key Public Benchmarks as at Quarter-End
5.5x
+6%
(6)%
Peer
Average
10%
2%
• Digital Wealth Managers
66%
6.0x
"Peer Top Quartile" data points are the average metrics of the top quartile peers in terms of revenue multiple
+4%
1%
Peer Top
Quartile
(2)%
74%
9.1x
+7%
+9%
15%
Financial Statements
• Subscription Businesses
8%
(10)%
20%
Unlisted Portfolio Weight
Other
Fair Value Change (Q/Q)
• Software Licensing
25%
• High-Growth SaaS
30%
35%
34View entire presentation