Sterling Results Presentation Deck
Full year 2021 Financial Highlights
Revenue
Chart in $ millions
17
$454.1
2020
+41.4%1
$641.9
2021
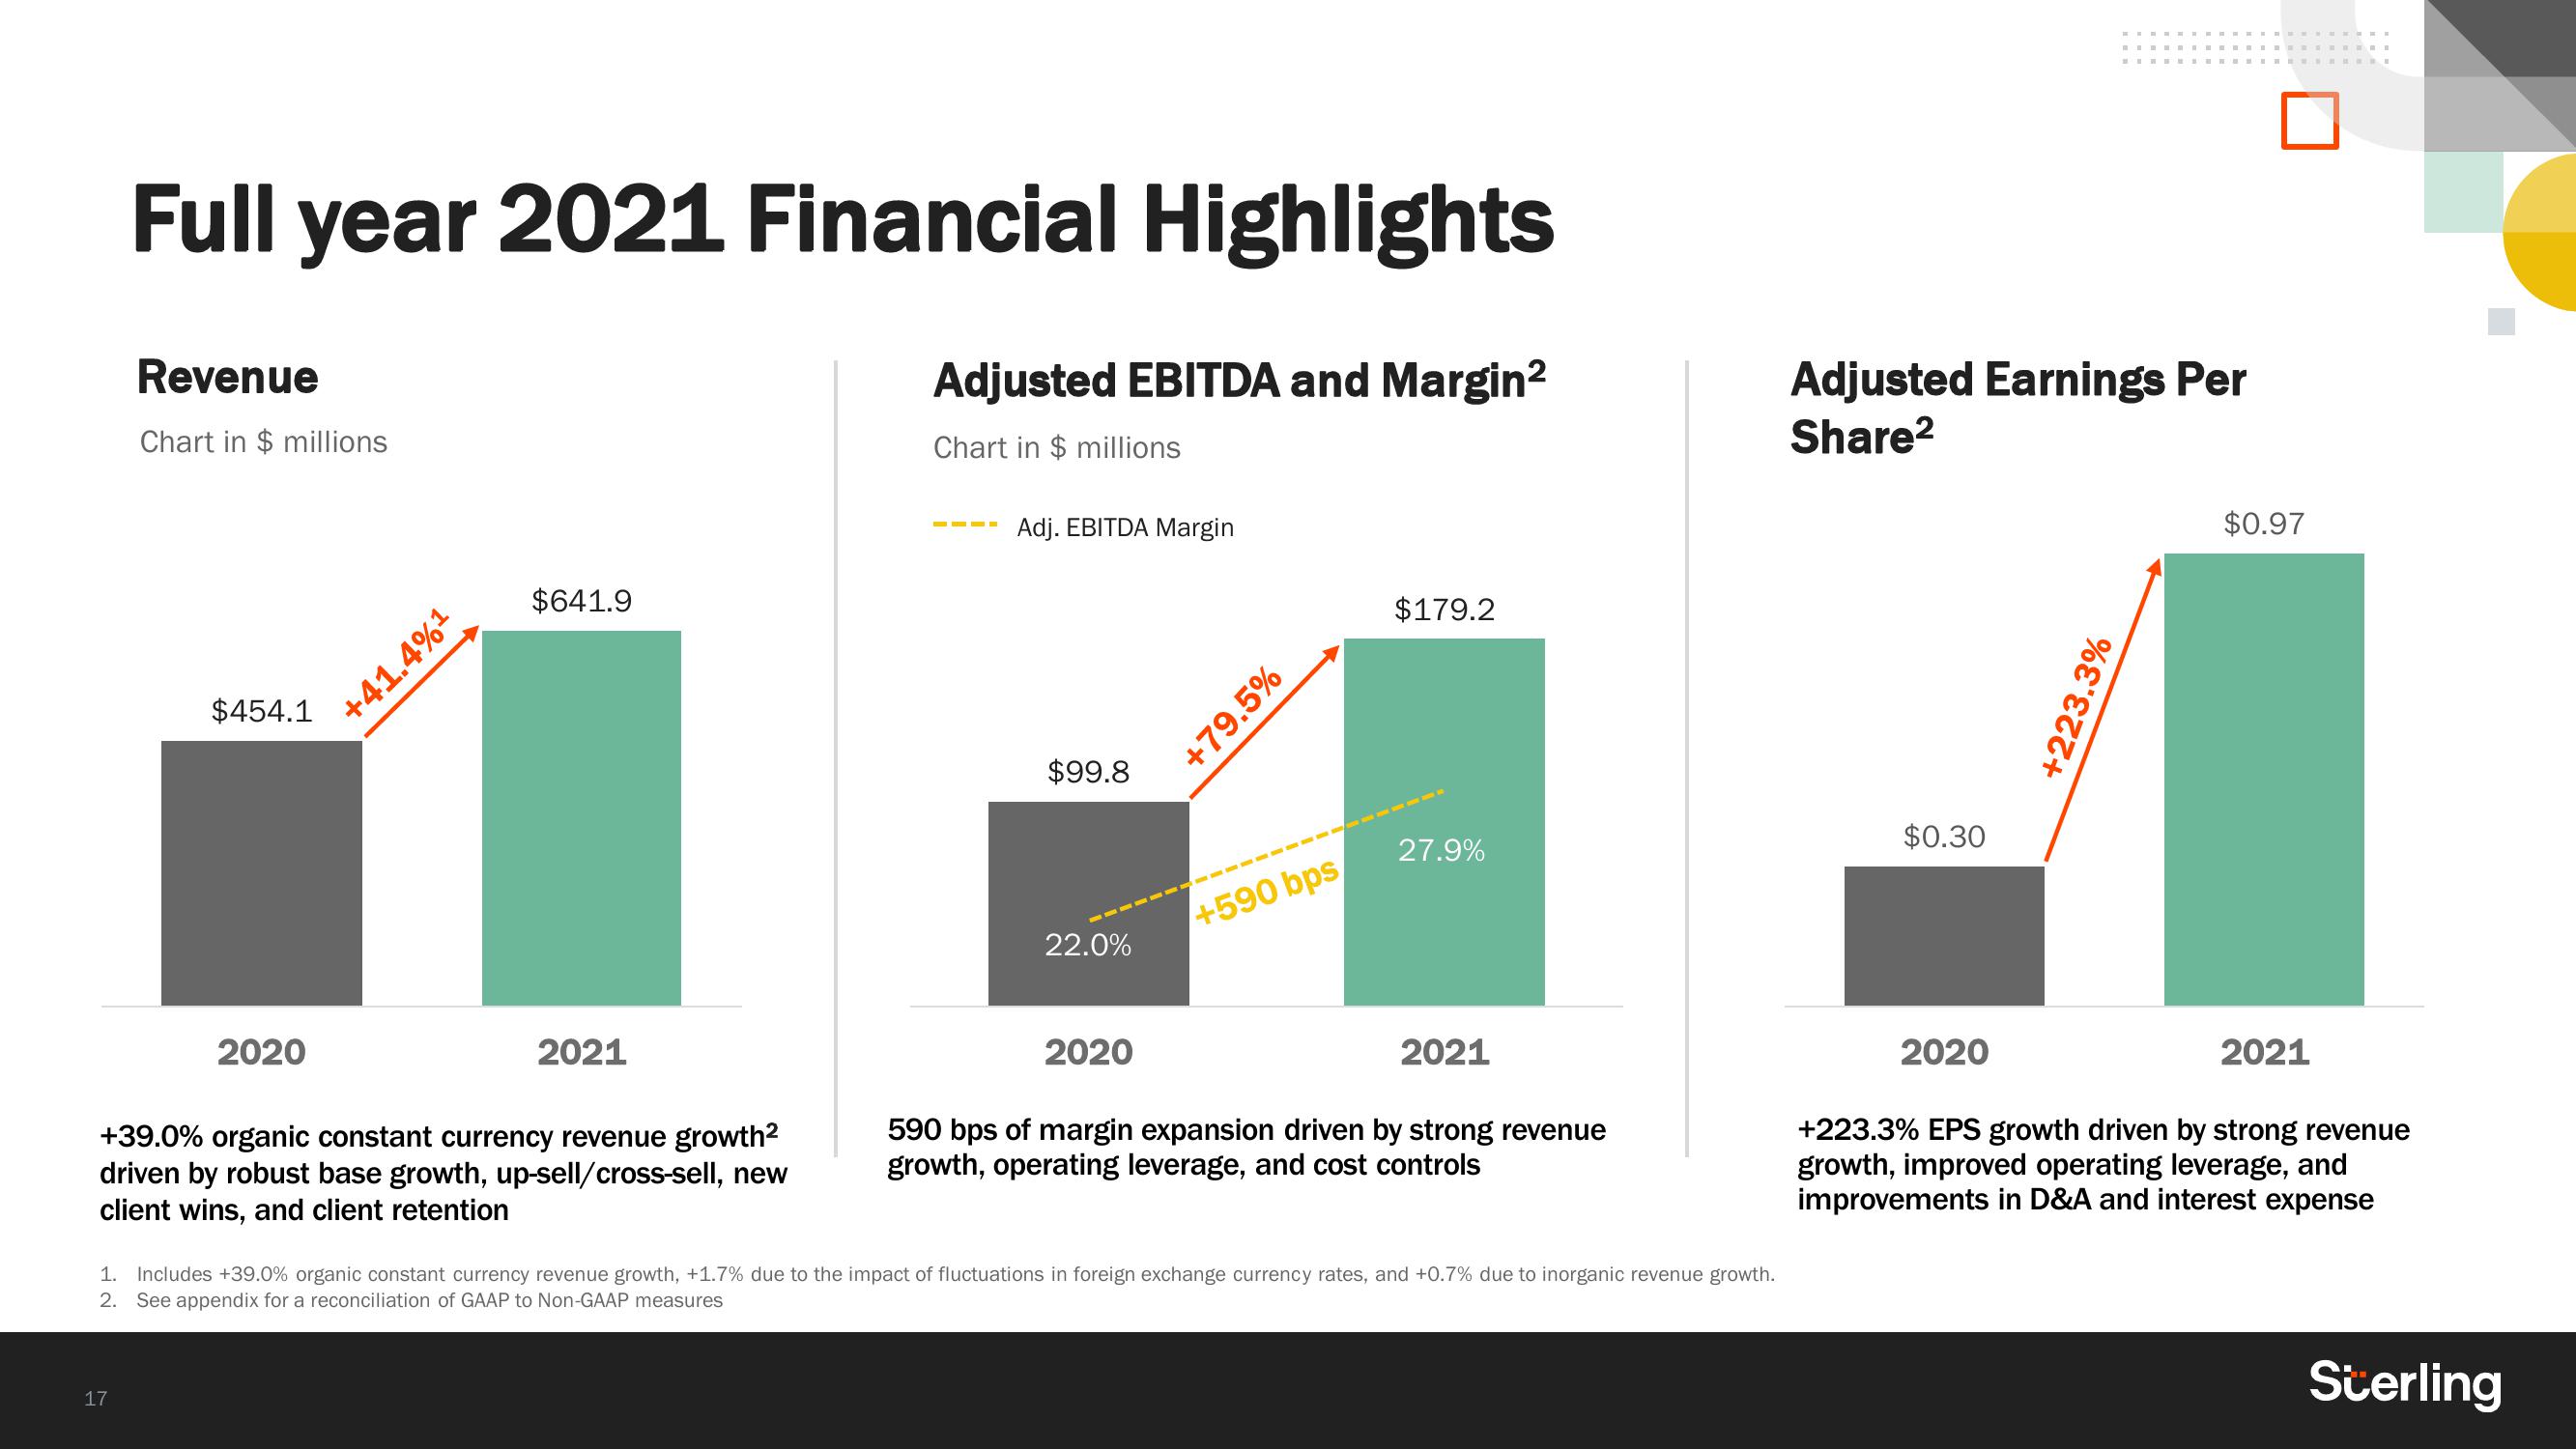
+39.0% organic constant currency revenue growth²
driven by robust base growth, up-sell/cross-sell, new
client wins, and client retention
Adjusted EBITDA and Margin²
Chart in $ millions
Adj. EBITDA Margin
$99.8
22.0%
2020
+79.5%
+590 bps
$179.2
27.9%
2021
590 bps of margin expansion driven by strong revenue
growth, operating leverage, and cost controls
1. Includes +39.0% organic constant currency revenue growth, +1.7% due to the impact of fluctuations in foreign exchange currency rates, and +0.7% due to inorganic revenue growth.
2. See appendix for a reconciliation GAAP to Non-GAAP measures
Adjusted Earnings Per
Share²
$0.30
2020
+223.3%
$0.97
2021
+223.3% EPS growth driven by strong revenue
growth, improved operating leverage, and
improvements in D&A and interest expense
SterlingView entire presentation