Jefferies Financial Group Investor Day Presentation Deck
Jefferies Finance - Overview
H
Jefferies Finance ("JFIN") continues to operate prudently
JFIN has demonstrated growth and resilience across multiple business cycles, including the
current economic disruption
JFIN has built a highly successful franchise arranging leveraged loans for distribution to the
capital markets and has successfully arranged >1,400 transactions ($290 billion of financing)
since inception
JFIN also provides direct lending to Jefferies' clients through Jefferies Credit Partners ("JCP"),
JFIN's private credit investment team
JFIN manages CLOs through Apex Credit Partners ("Apex"), which runs 29 term loan CLOS
and revolver funding vehicles, a large share of which were arranged by Jefferies
Managed capital across all business lines exceeds $17 billion(1)
JFIN's strategy will remain focused on core U.S. and European underwriting business,
and furthering the success of our large cap and mid cap direct lending (both origination
and asset management), which represents a significant growth opportunity
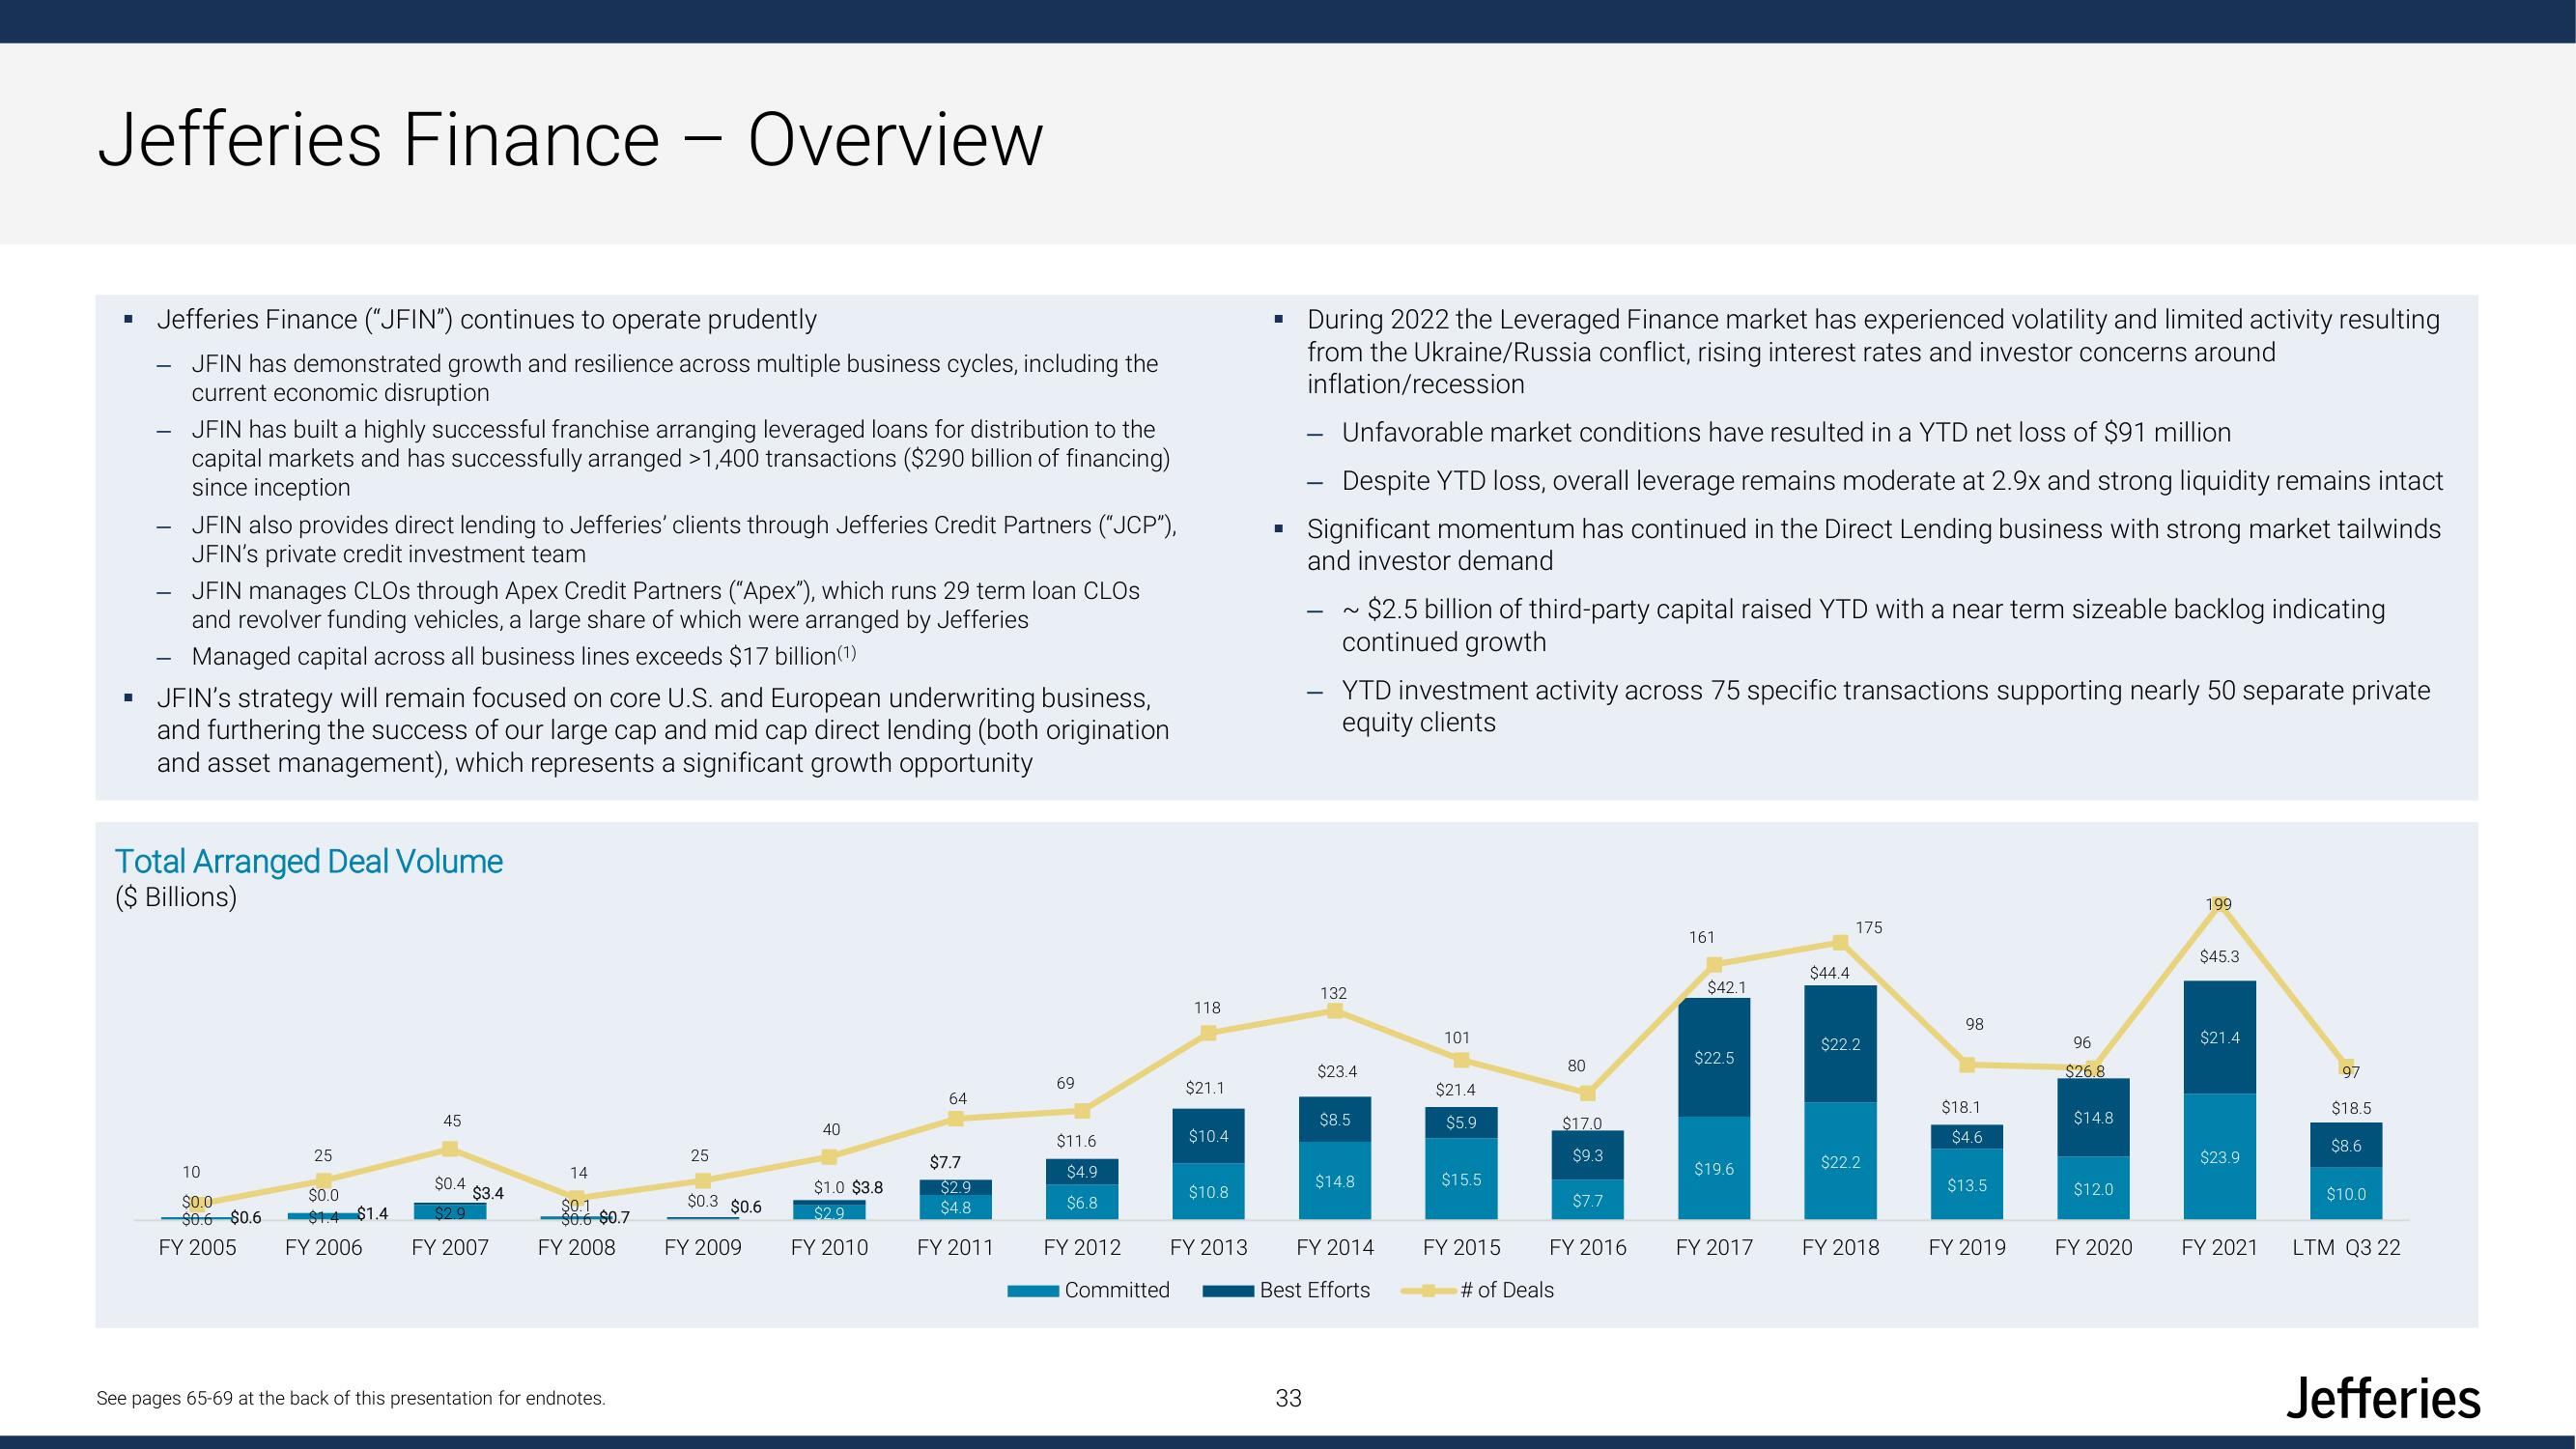
Total Arranged Deal Volume
($ Billions)
10
$0.0
$0.6 $0.6
FY 2005
25
$0.0
$14 $1.4
FY 2006
45
$0.4
$2.9
FY 2007
$3.4
14
$0.1
$0.6 $0.7
FY 2008
See pages 65-69 at the back of this presentation for endnotes.
25
$0.3 $0.6
FY 2009
40
$1.0 $3.8
$2.9
FY 2010
64
$7.7
$2.9
$4.8
FY 2011
69
$11.6
$4.9
$6.8
FY 2012
Committed
118
$21.1
$10.4
$10.8
FY 2013
■
I
During 2022 the Leveraged Finance market has experienced volatility and limited activity resulting
from the Ukraine/Russia conflict, rising interest rates and investor concerns around
inflation/recession
Unfavorable market conditions have resulted in a YTD net loss of $91 million
Despite YTD loss, overall leverage remains moderate at 2.9x and strong liquidity remains intact
Significant momentum has continued in the Direct Lending business with strong market tailwinds
and investor demand
33
~$2.5 billion of third-party capital raised YTD with a near term sizeable backlog indicating
continued growth
YTD investment activity across 75 specific transactions supporting nearly 50 separate private
equity clients
132
$23.4
$8.5
$14.8
FY 2014
Best Efforts
101
$21.4
$5.9
$15.5
FY 2015
80
# of Deals
$17.0
$9.3
$7.7
FY 2016
161
$42.1
$22.5
$19.6
FY 2017
$44.4
175
$22.2
$22.2
FY 2018
98
$18.1
$4.6
$13.5
FY 2019
96
$26.8
$14.8
$12.0
FY 2020
199
$45.3
$21.4
$23.9
FY 2021
97
$18.5
$8.6
$10.0
LTM Q3 22
JefferiesView entire presentation