Credit Suisse Investment Banking Pitch Book
PRELIMINARY | SUBJECT TO FURTHER REVIEW & REVISION
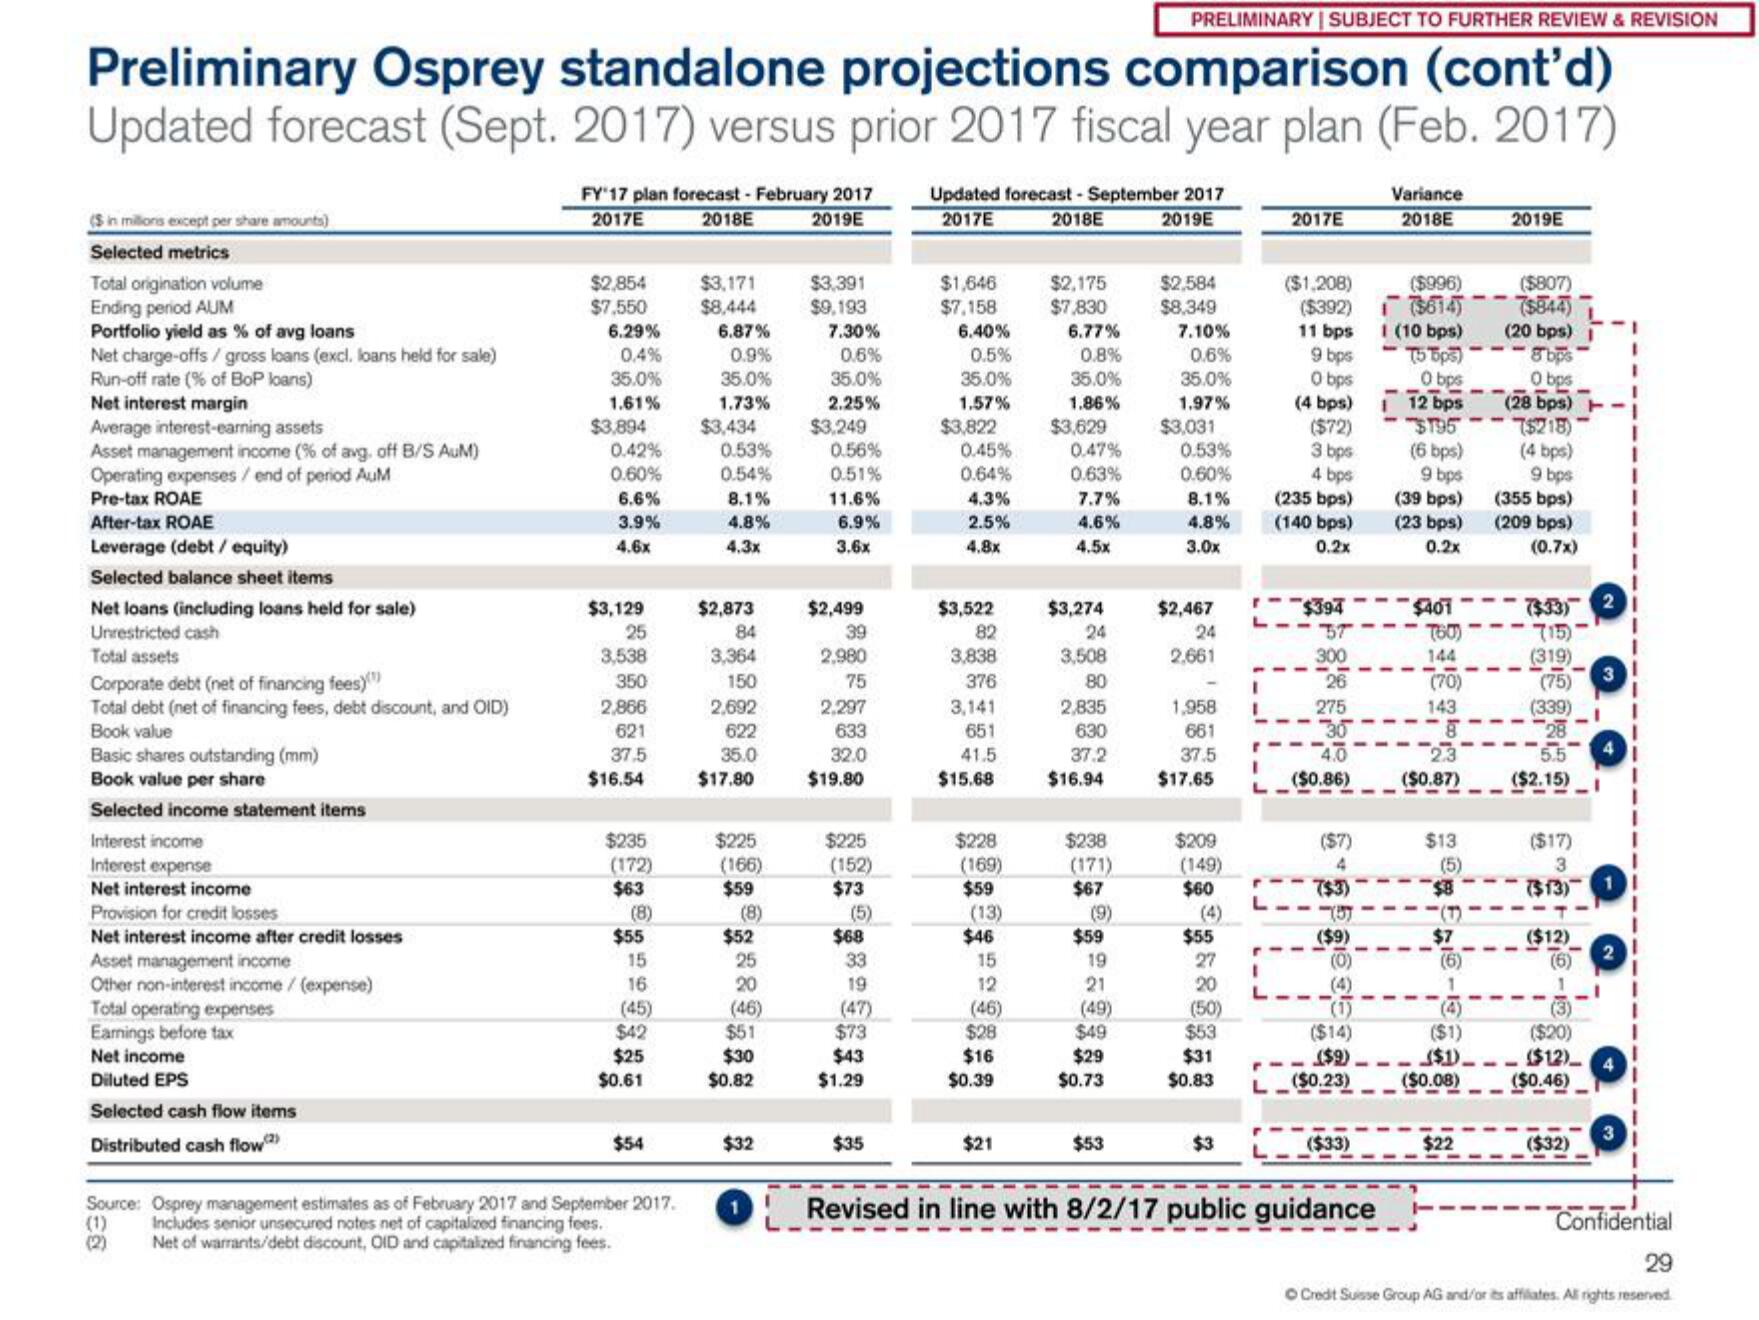
Preliminary Osprey standalone projections comparison (cont'd)
Updated forecast (Sept. 2017) versus prior 2017 fiscal year plan (Feb. 2017)
($ in millions except per share amounts)
Selected metrics
Total origination volume
Ending period AUM
Portfolio yield as % of avg loans
Net charge-offs / gross loans (excl. loans held for sale)
Run-off rate (% of BoP loans)
Net interest margin
Average interest-earning assets
Asset management income (% of avg. off B/S AuM)
Operating expenses / end of period AuM
Pre-tax ROAE
After-tax ROAE
Leverage (debt / equity)
Selected balance sheet items
Net loans (including loans held for sale)
Unrestricted cash
Total assets
Corporate debt (net of financing fees)
Total debt (net of financing fees, debt discount, and OID)
Book value
Basic shares outstanding (mm)
Book value per share
Selected income statement items
Interest income
Interest expense
Net interest income
Provision for credit losses
Net interest income after credit losses
Asset management income
Other non-interest income / (expense)
Total operating expenses
Earnings before tax
Net income
Diluted EPS
Selected cash flow items
Distributed cash flow (2)
FY'17 plan forecast - February 2017
2017E
2018E
2019E
$2,854
$7,550
6.29%
0.4%
35.0%
1.61%
$3.894
0.42%
0.60%
6.6%
3.9%
4.6x
$3,129
25
3,538
350
2,866
621
37.5
$16.54
$235
(172)
$63
(8)
$55
15
16
(45)
$42
$25
$0.61
$54
Source: Osprey management estimates as of February 2017 and September 2017.
(1)
Includes senior unsecured notes net of capitalized financing fees.
(2)
Net of warrants/debt discount, OID and capitalized financing fees.
$3,171
$8,444
6.87%
0.9%
35.0%
1.73%
$3,434
0.53%
0.54%
8.1%
4.8%
4.3x
$2,873
84
3,364
150
2,692
622
35.0
$17.80
$225
(166)
$59
(8)
$52
25
20
(46)
$51
$30
$0.82
$32
$3,391
$9,193
7.30%
0.6%
35.0%
2.25%
$3,249
0.56%
0.51%
11.6%
6.9%
3.6x
$2,499
39
2,980
75
2,297
633
32.0
$19.80
$225
(152)
$73
(5)
$68
33
19
(47)
$73
$43
$1.29
$35
Updated forecast - September 2017
2017E
2018E 2019E
$1,646
$7,158
6.40%
0.5%
35.0%
1.57%
$3,822
0.45%
0.64%
4.3%
2.5%
4.8x
$3,522
82
3,838
376
3,141
651
41.5
$15.68
$228
(169)
$59
(13)
$46
15
12
(46)
$28
$16
$0.39
$21
$2,175
$7,830
6.77%
0.8%
35.0%
1.86%
$3,629
0.47%
0.63%
7.7%
4.6%
4.5x
$3,274
24
3,508
80
2,835
630
37.2
$16.94
$238
(171)
$67
(9)
$59
19
21
(49)
$49
$29
$0.73
$53
$2,584
$8,349
7.10%
0.6%
35.0%
1.97%
$3,031
0.53%
0.60%
8.1%
4.8%
3.0x
$2,467
24
2.661
1,958
661
37.5
$17.65
$209
(149)
$60
$55
27
20
(50)
$53
$31
$0.83
$3
L
I
2017E
($1,208)
($392)
11 bps
9 bps
0 bps
(4 bps)
($72)
3 bps
4 bps
(235 bps)
(140 bps)
0.2x
--$394
57
300
275
30
4.0
($0.86)
($7)
4
(57
($9)
($14)
($9)
($0.23)
($33)
1 Revised in line with 8/2/17 public guidance
Variance
2018E
($996)
($614)
1 (10 bps)
T5 Tops)
0 bps
12 bps
ST95
(6 bps)
9 bps
(39 bps)
(23 bps)
0.2x
$401
760)
144
(70)
143
-8
2.3
($0.87)
$13
(5)
($1)
($0.08)
2019E
$22
($807)
($844)
(20 bps)
8bps
0 bps
(28 bps)
-7$218)
(4 bps)
9 bps
(355 bps)
(209 bps)
(0.7x)
($33)
715)
(319)
(75)
(339)
28
($2.15)
($17)
3
($13) 1
($12)
($1)__($12)__
($0.46)
($20)
($32)
J
Confidential
29
Ⓒ Credit Suisse Group AG and/or its affiliates. All rights reservedView entire presentation