WeWork Investor Presentation Deck
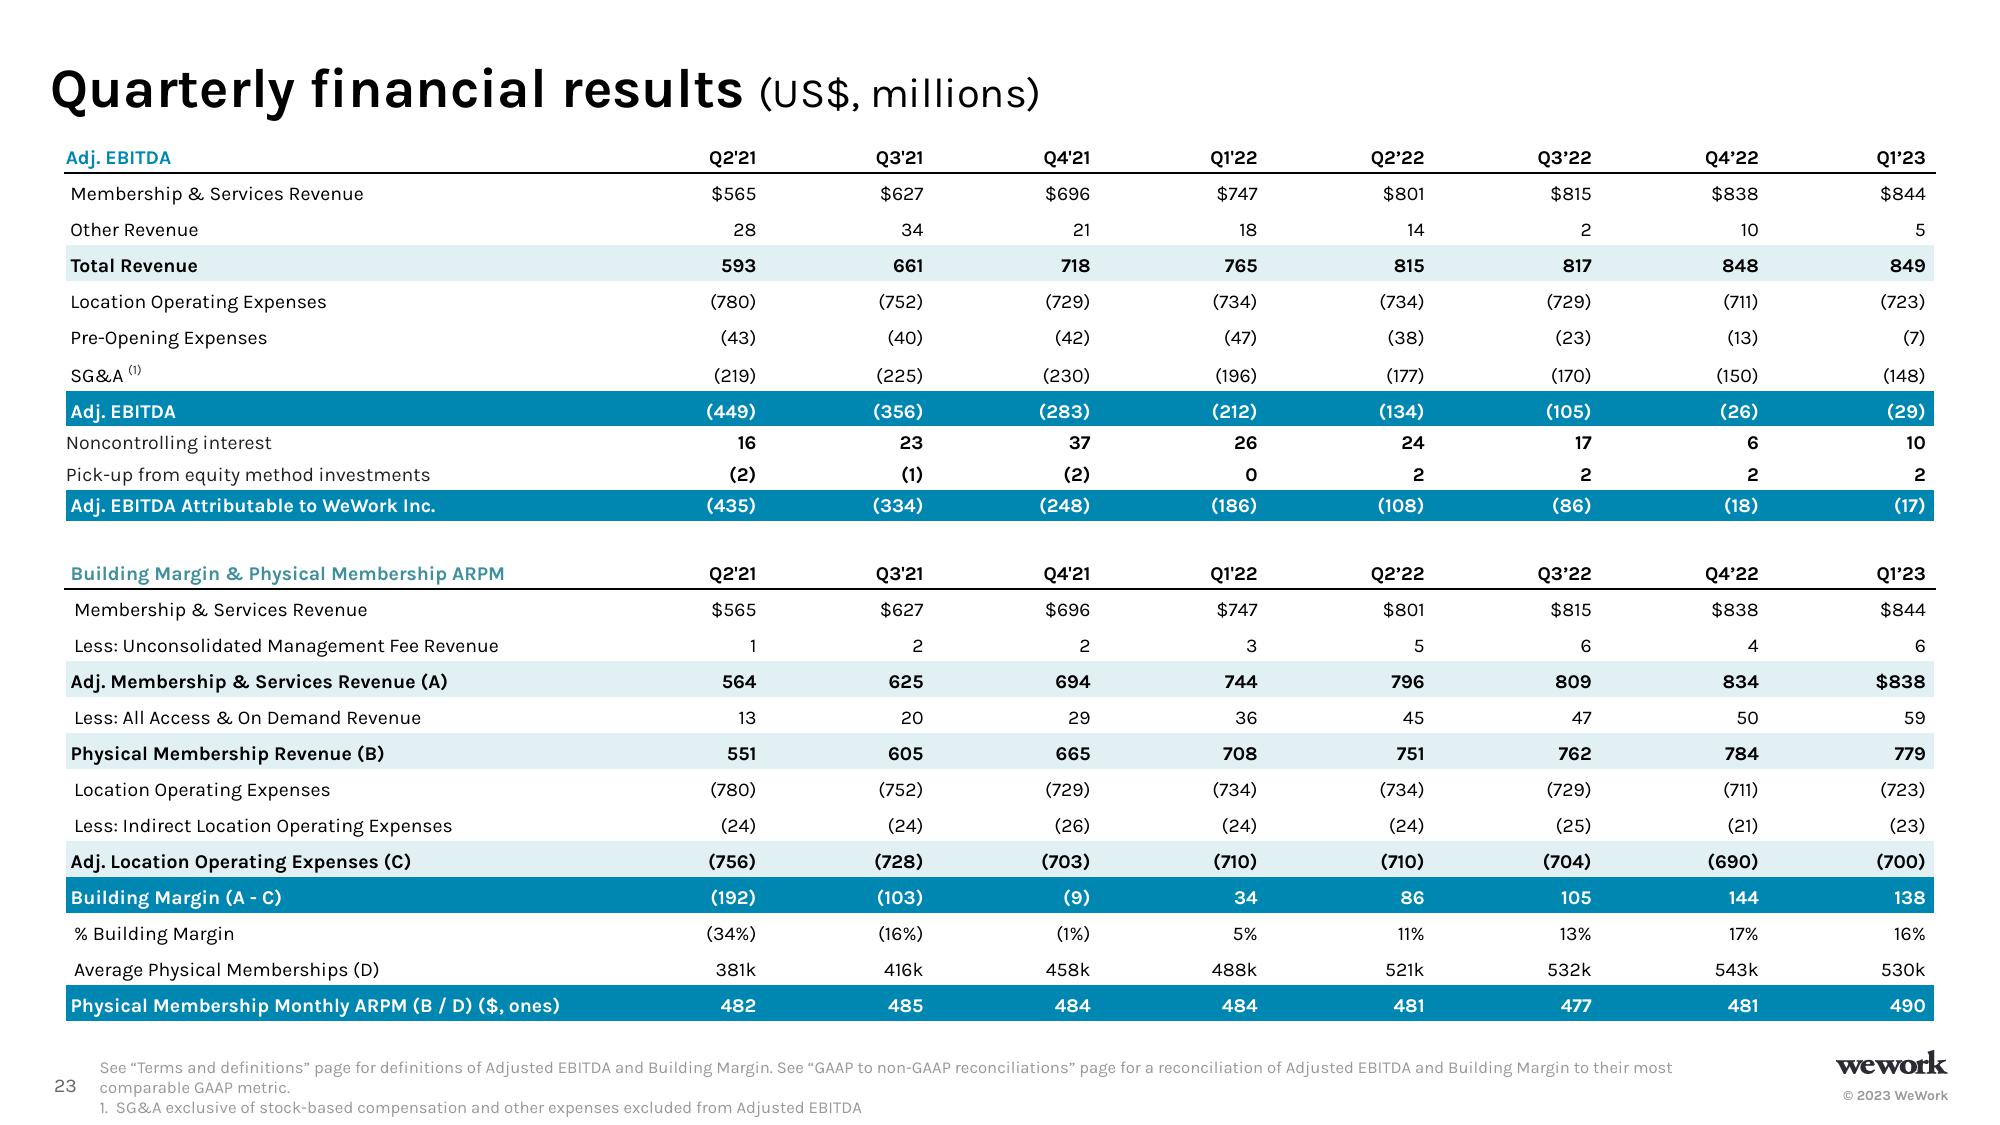
Quarterly financial results (US$, millions)
Adj. EBITDA
Membership & Services Revenue
Other Revenue
Total Revenue
Location Operating Expenses
Pre-Opening Expenses
(1)
SG&A
Adj. EBITDA
Noncontrolling interest
Pick-up from equity method investments
Adj. EBITDA Attributable to WeWork Inc.
Building Margin & Physical Membership ARPM
Membership & Services Revenue
Less: Unconsolidated Management Fee Revenue
Adj. Membership & Services Revenue (A)
Less: All Access & On Demand Revenue
Physical Membership Revenue (B)
Location Operating Expenses
Less: Indirect Location Operating Expenses
Adj. Location Operating Expenses (C)
Building Margin (A - C)
% Building Margin
Average Physical Memberships (D)
Physical Membership Monthly ARPM (B / D) ($, ones)
23
Q2'21
$565
28
593
(780)
(43)
(219)
(449)
16
(2)
(435)
Q2'21
$565
1
564
13
551
(780)
(24)
(756)
(192)
(34%)
381k
482
Q3'21
$627
34
661
(752)
(40)
(225)
(356)
23
(1)
(334)
Q3'21
$627
2
625
20
605
(752)
(24)
(728)
(103)
(16%)
416k
485
Q4'21
$696
21
718
(729)
(42)
(230)
(283)
37
(2)
(248)
Q4'21
$696
2
694
29
665
(729)
(26)
(703)
(9)
(1%)
458k
484
Q1'22
$747
18
765
(734)
(47)
(196)
(212)
26
0
(186)
Q1'22
$747
3
744
36
708
(734)
(24)
(710)
34
5%
488k
484
Q2'22
$801
14
815
(734)
(38)
(177)
(134)
24
2
(108)
Q2'22
$801
5
796
45
751
(734)
(24)
(710)
86
11%
521k
481
Q3'22
$815
2
817
(729)
(23)
(170)
(105)
17
2
(86)
Q3'22
$815
6
809
47
762
(729)
(25)
(704)
105
13%
532k
477
See "Terms and definitions" page for definitions of Adjusted EBITDA and Building Margin. See "GAAP to non-GAAP reconciliations" page for a reconciliation of Adjusted EBITDA and Building Margin to their most
comparable GAAP metric.
1. SG&A exclusive of stock-based compensation and other expenses excluded from Adjusted EBITDA
Q4'22
$838
10
848
(711)
(13)
(150)
(26)
6
2
(18)
Q4'22
$838
4
834
50
784
(711)
(21)
(690)
144
17%
543k
481
Q1'23
$844
5
849
(723)
(7)
(148)
(29)
10
2
(17)
Q1'23
$844
6
$838
59
779
(723)
(23)
(700)
138
16%
530k
490
wework
Ⓒ2023 WeWorkView entire presentation