Freyr SPAC Presentation Deck
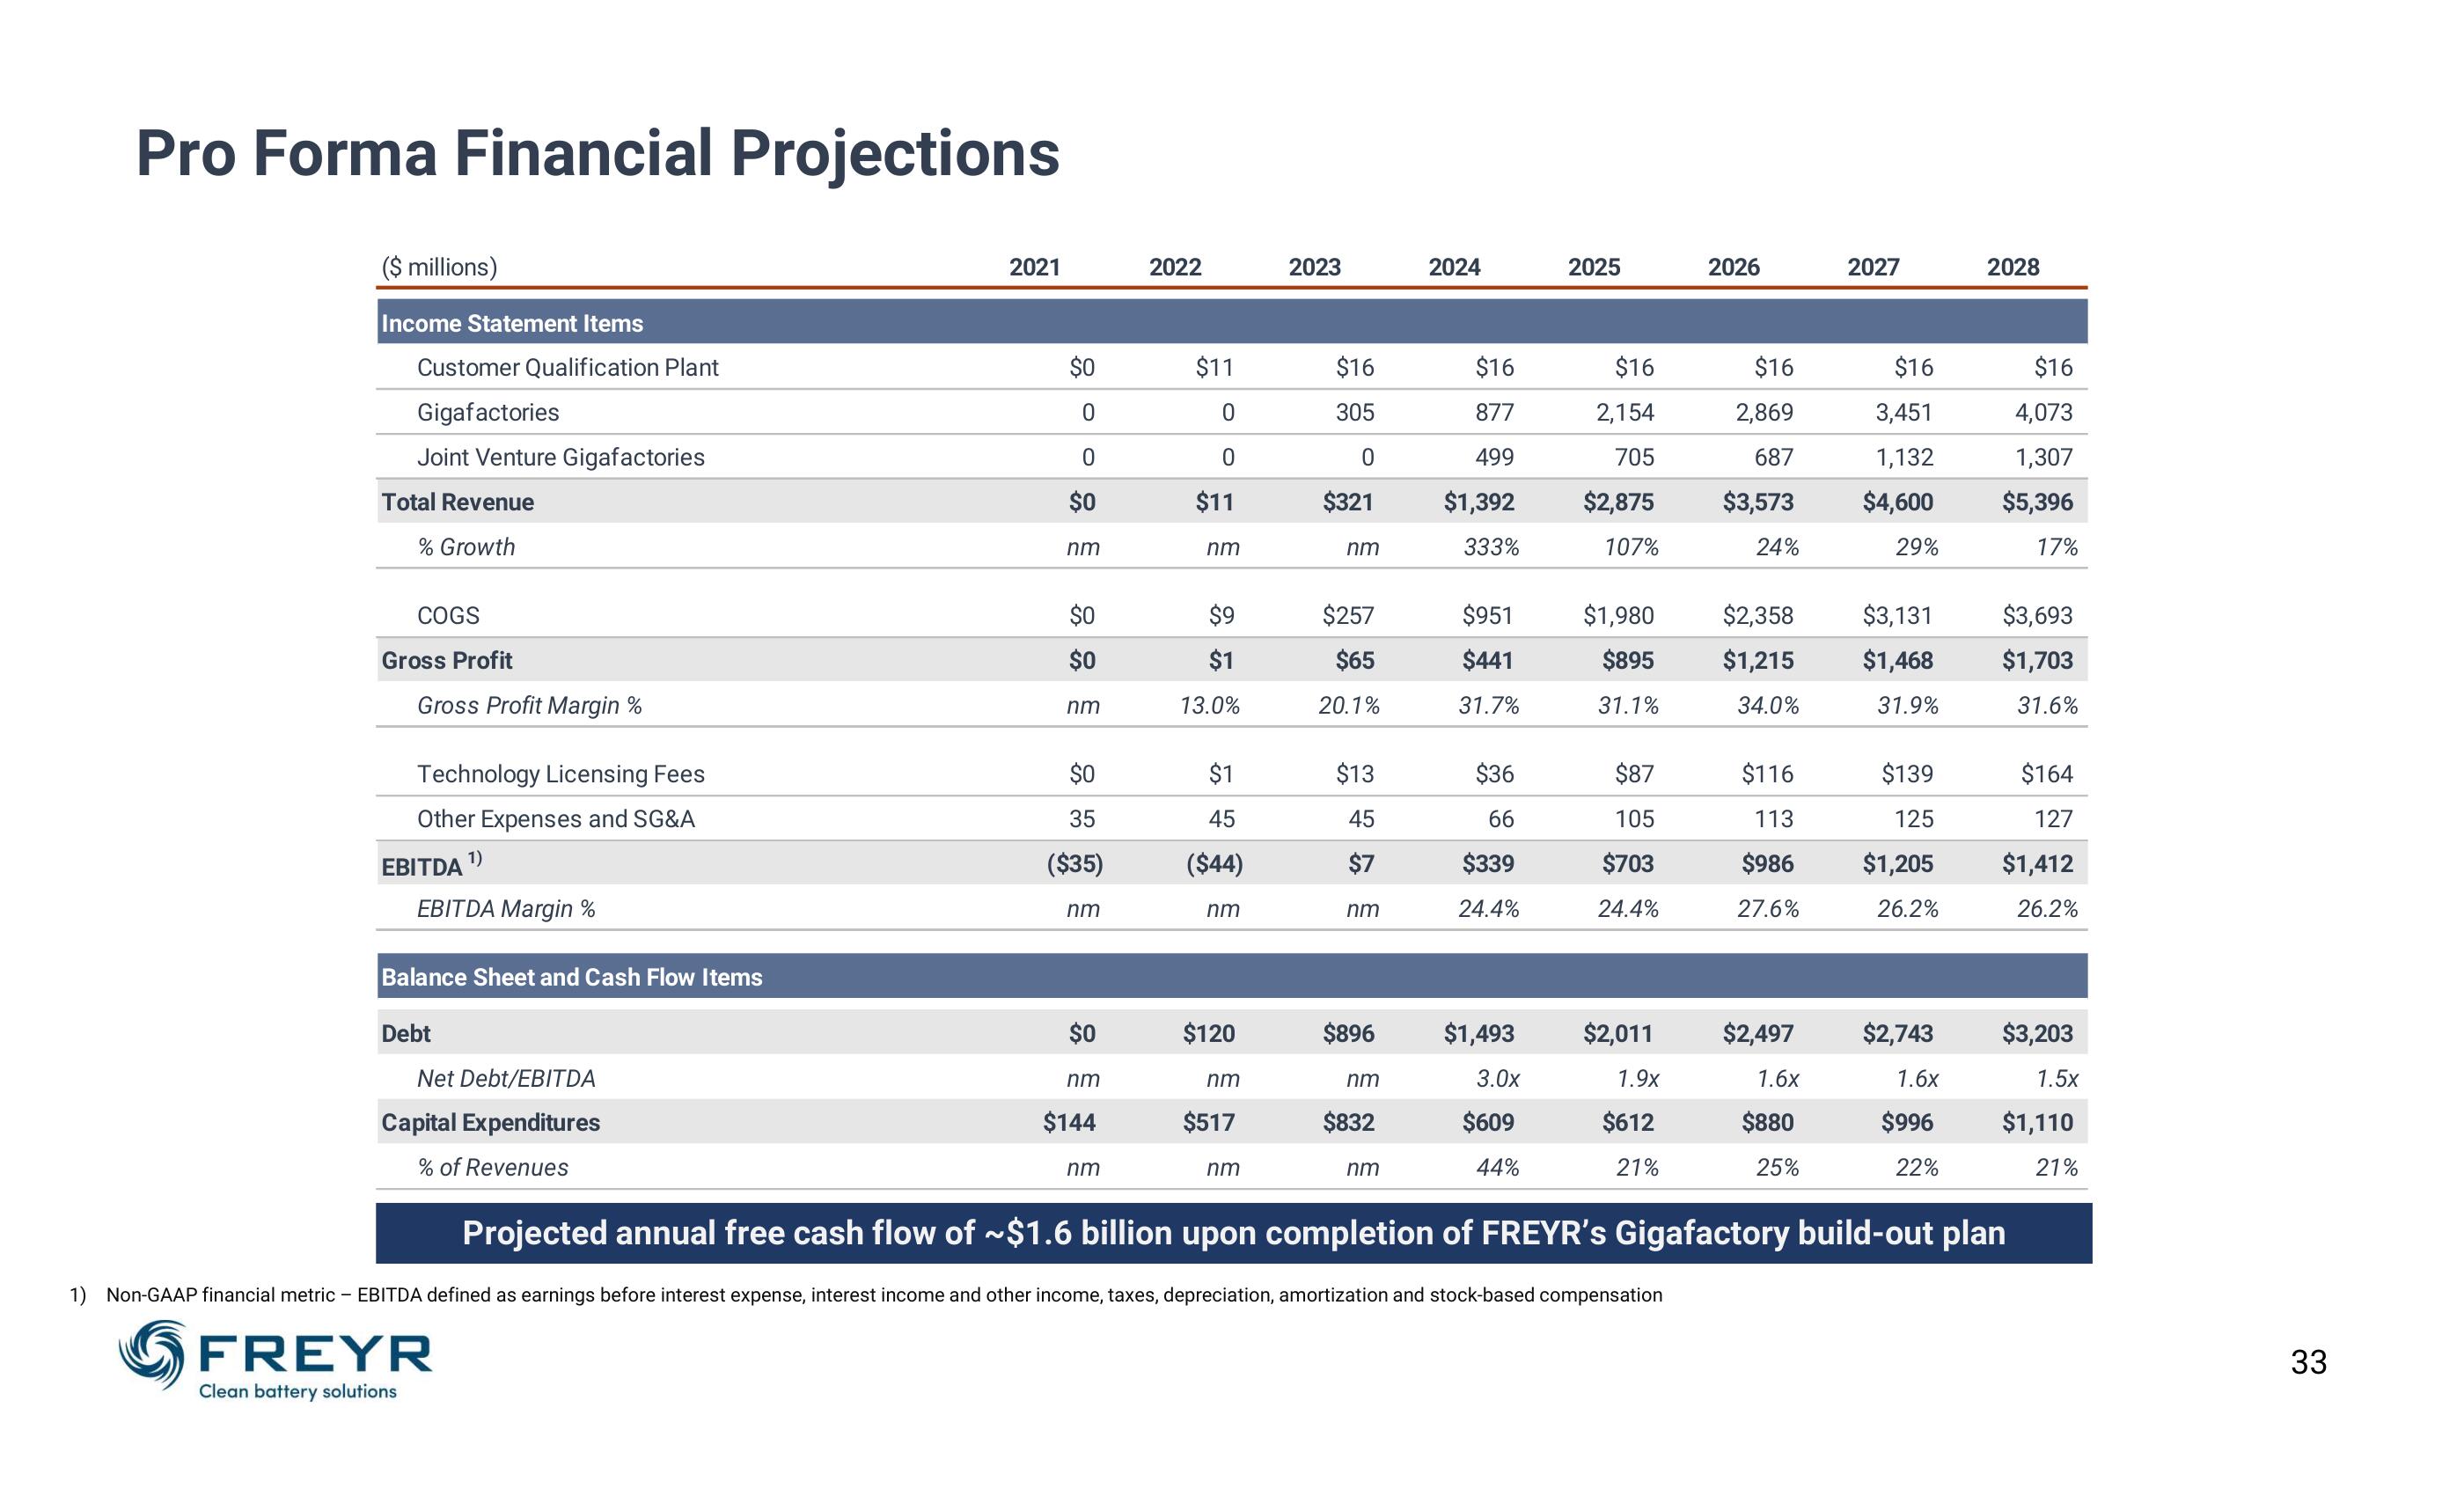
Pro Forma Financial Projections
($ millions)
Income Statement Items
Customer Qualification Plant
Gigafactories
Joint Venture Gigafactories
Total Revenue
% Growth
COGS
Gross Profit
Gross Profit Margin %
Technology Licensing Fees
Other Expenses and SG&A
EBITDA ¹)
EBITDA Margin %
Balance Sheet and Cash Flow Items
Debt
Net Debt/EBITDA
Capital Expenditures
% of Revenues
2021
$0
0
0
$0
nm
$0
$0
nm
$0
35
($35)
nm
$0
nm
$144
nm
2022
$11
0
$11
nm
$9
$1
13.0%
$1
45
($44)
nm
$120
nm
$517
nm
2023
$16
305
0
$321
nm
$257
$65
20.1%
$13
45
$7
nm
$896
nm
$832
nm
2024
$16
877
499
$1,392
333%
$951
$441
31.7%
$36
66
$339
24.4%
$1,493
3.0x
$609
44%
2025
$16
2,154
705
$2,875
107%
$1,980
$895
31.1%
$87
105
$703
24.4%
$2,011
1.9x
$612
21%
2026
1) Non-GAAP financial metric - EBITDA defined as earnings before interest expense, interest income and other income, taxes, depreciation, amortization and stock-based compensation
FREYR
Clean battery solutions
$16
2,869
687
$3,573
24%
$2,358
$1,215
34.0%
$116
113
$986
27.6%
$2,497
1.6x
$880
25%
2027
$16
3,451
1,132
$4,600
29%
$3,131
$1,468
31.9%
$139
125
$1,205
26.2%
$2,743
1.6x
$996
22%
2028
$16
4,073
1,307
$5,396
17%
$3,693
$1,703
31.6%
$164
127
$1,412
26.2%
Projected annual free cash flow of ~$1.6 billion upon completion of FREYR's Gigafactory build-out plan
$3,203
1.5x
$1,110
21%
33View entire presentation