Getty SPAC Presentation Deck
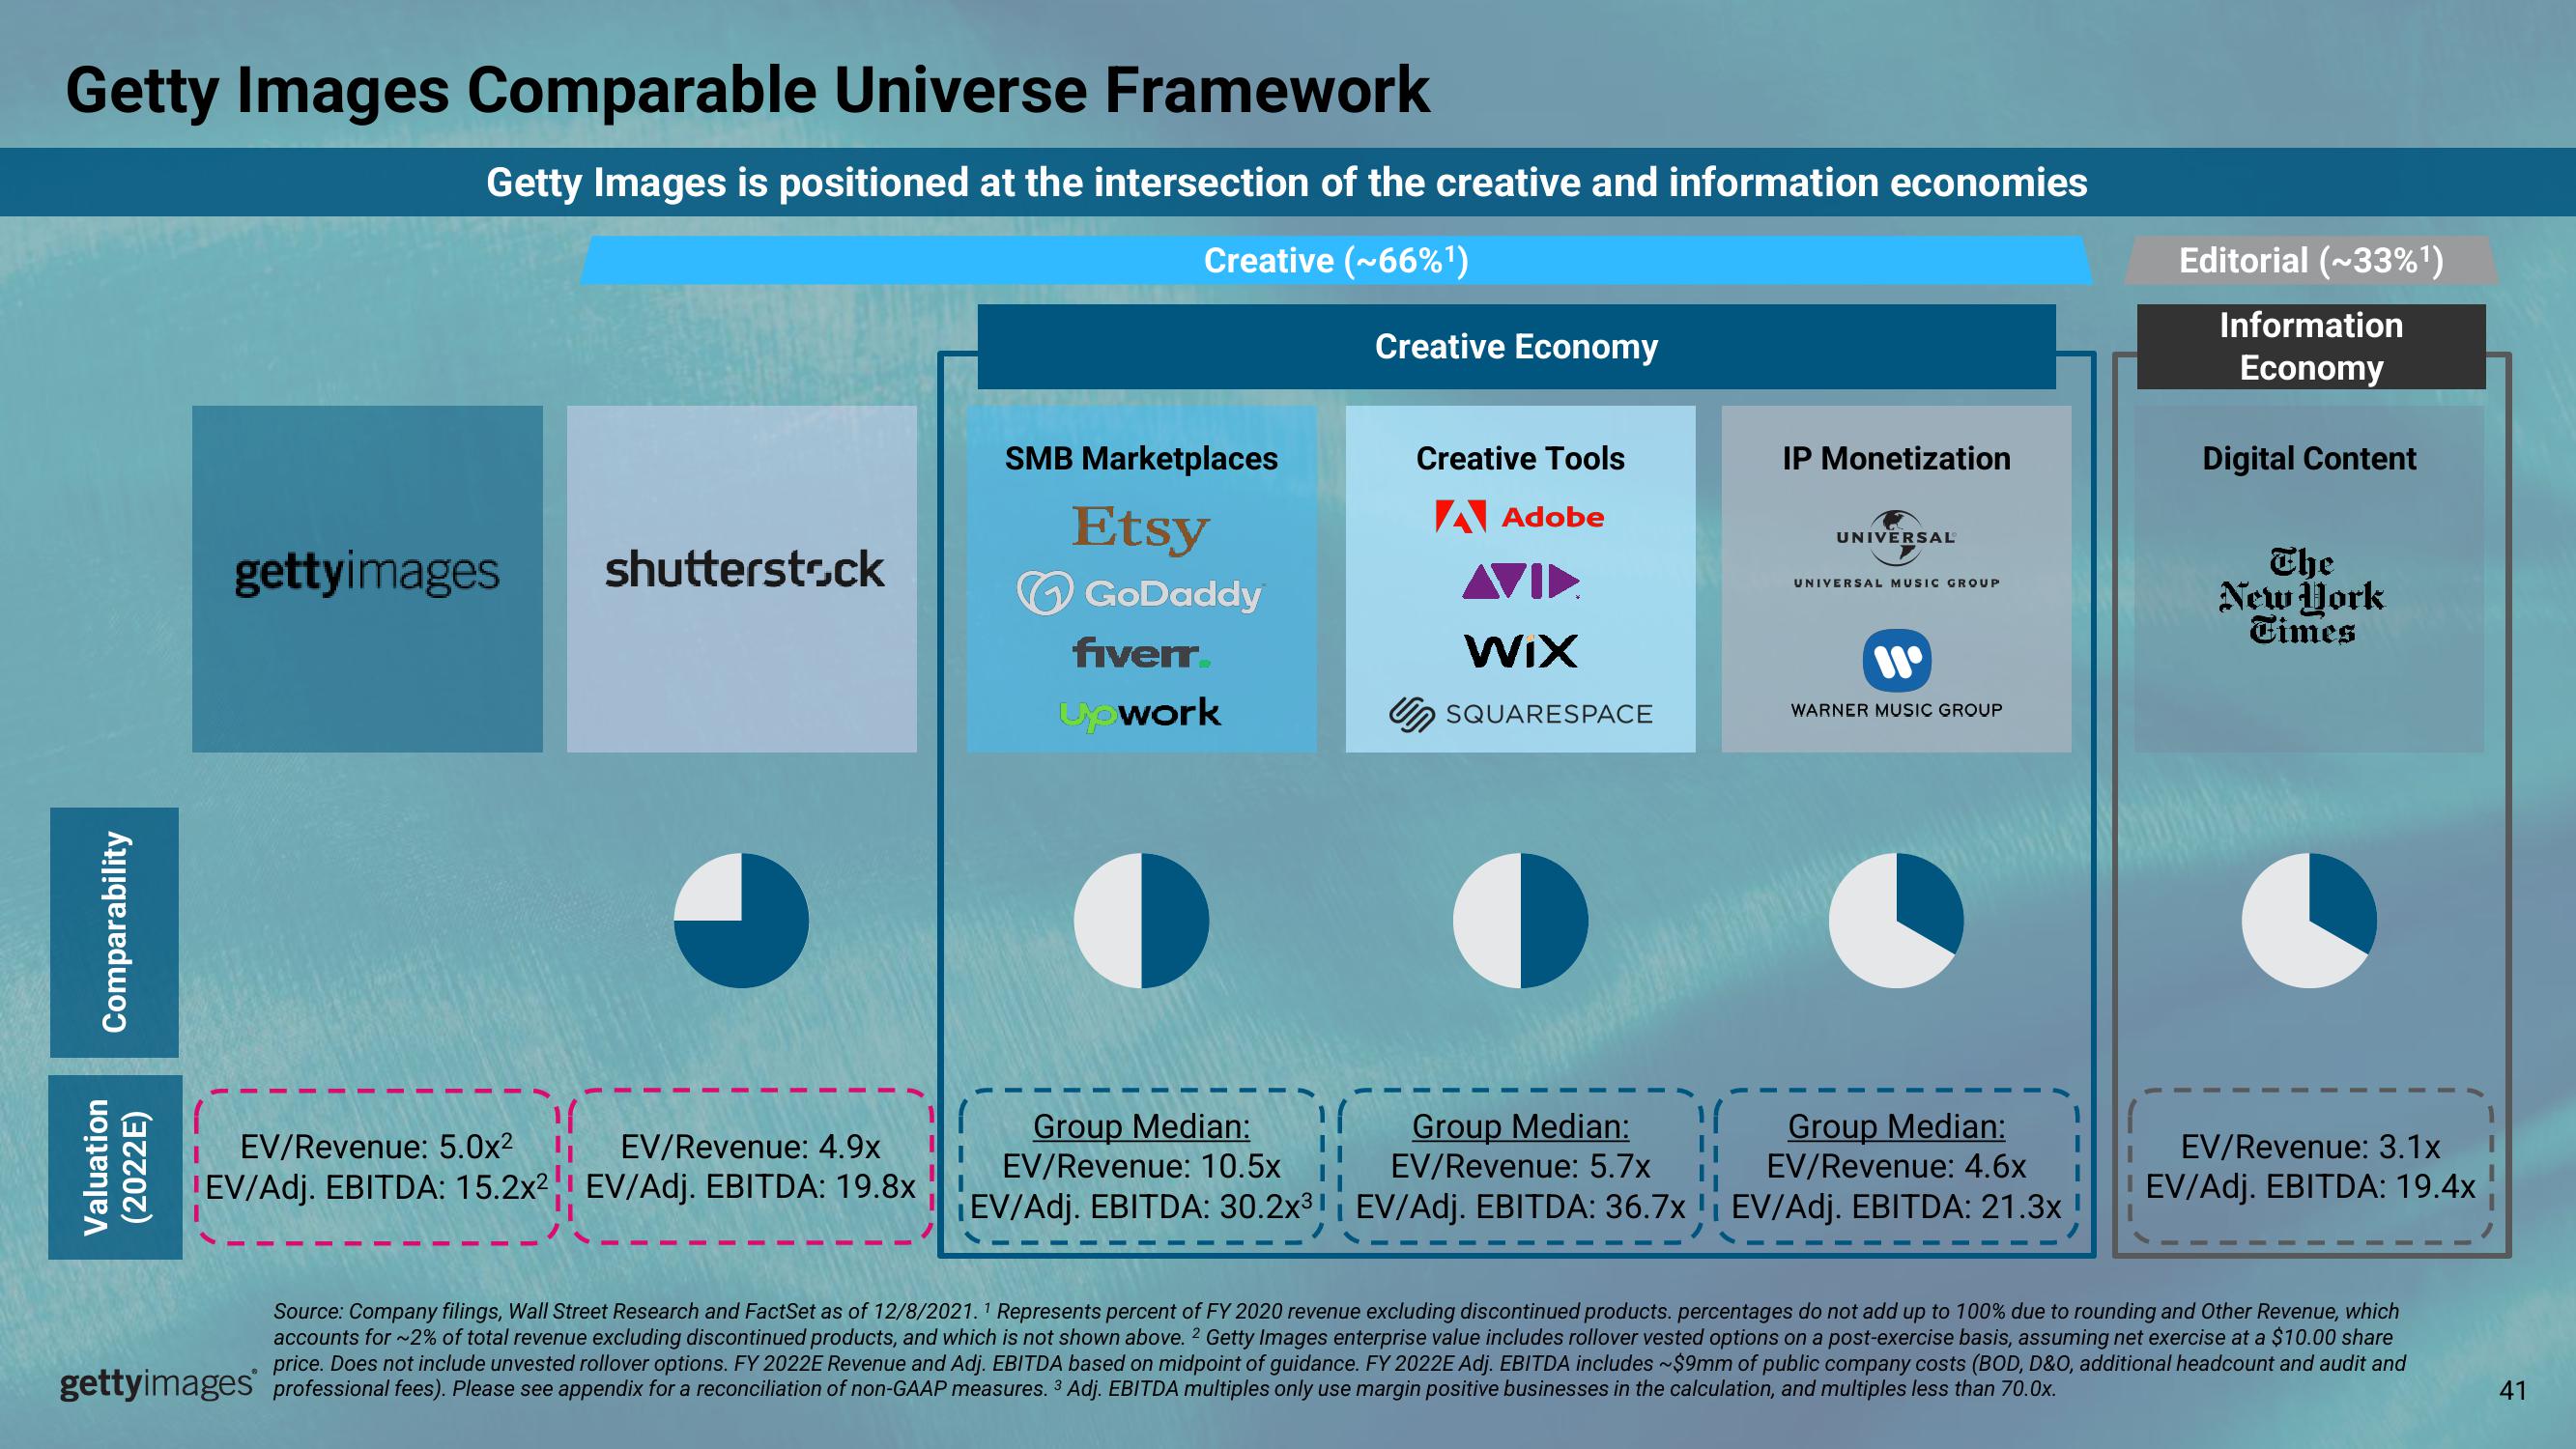
Getty Images Comparable Universe Framework
Comparability
Valuation
(2022E)
Getty Images is positioned at the intersection of the creative and information economies
Creative (~66%¹)
gettyimages
EV/Revenue: 5.0x²
EV/Adj. EBITDA: 15.2x²
shutterstock
EV/Revenue: 4.9x
EV/Adj. EBITDA: 19.8x
SMB Marketplaces
Etsy
GoDaddy
fiverr
Upwork
Group Median:
EV/Revenue: 10.5x
Creative Economy
Creative Tools
A Adobe
AVI▶
WIX
U SQUARESPACE
IP Monetization
UNIVERSAL
UNIVERSAL MUSIC GROUP
WARNER MUSIC GROUP
Group Median:
EV/Revenue: 5.7x
Group Median:
EV/Revenue: 4.6x
¡EV/Adj. EBITDA: 30.2x³1 | EV/Adj. EBITDA: 36.7x !| EV/Adj. EBITDA: 21.3x
Editorial (~33%¹)
Information
Economy
gettyimages professional fees). Please see appendix for a reconciliation of non-GAAP measures. 3 Adj. EBITDA multiples only use margin positive businesses in the calculation, and multiples less than 70.0x.
Digital Content
The
New York
Times
EV/Revenue: 3.1x
EV/Adj. EBITDA: 19.4x
Source: Company filings, Wall Street Research and FactSet as of 12/8/2021.1 Represents percent of FY 2020 revenue excluding discontinued products. percentages do not add up to 100% due to rounding and Other Revenue, which
accounts for ~2% of total revenue excluding discontinued products, and which is not shown above. 2 Getty Images enterprise value includes rollover vested options on a post-exercise basis, assuming net exercise at a $10.00 share
price. Does not include unvested rollover options. FY 2022E Revenue and Adj. EBITDA based on midpoint of guidance. FY 2022E Adj. EBITDA includes ~$9mm of public company costs (BOD, D&O, additional headcount and audit and
41View entire presentation