Blackwells Capital Activist Presentation Deck slide image

Blackwells Capital Activist Presentation Deck

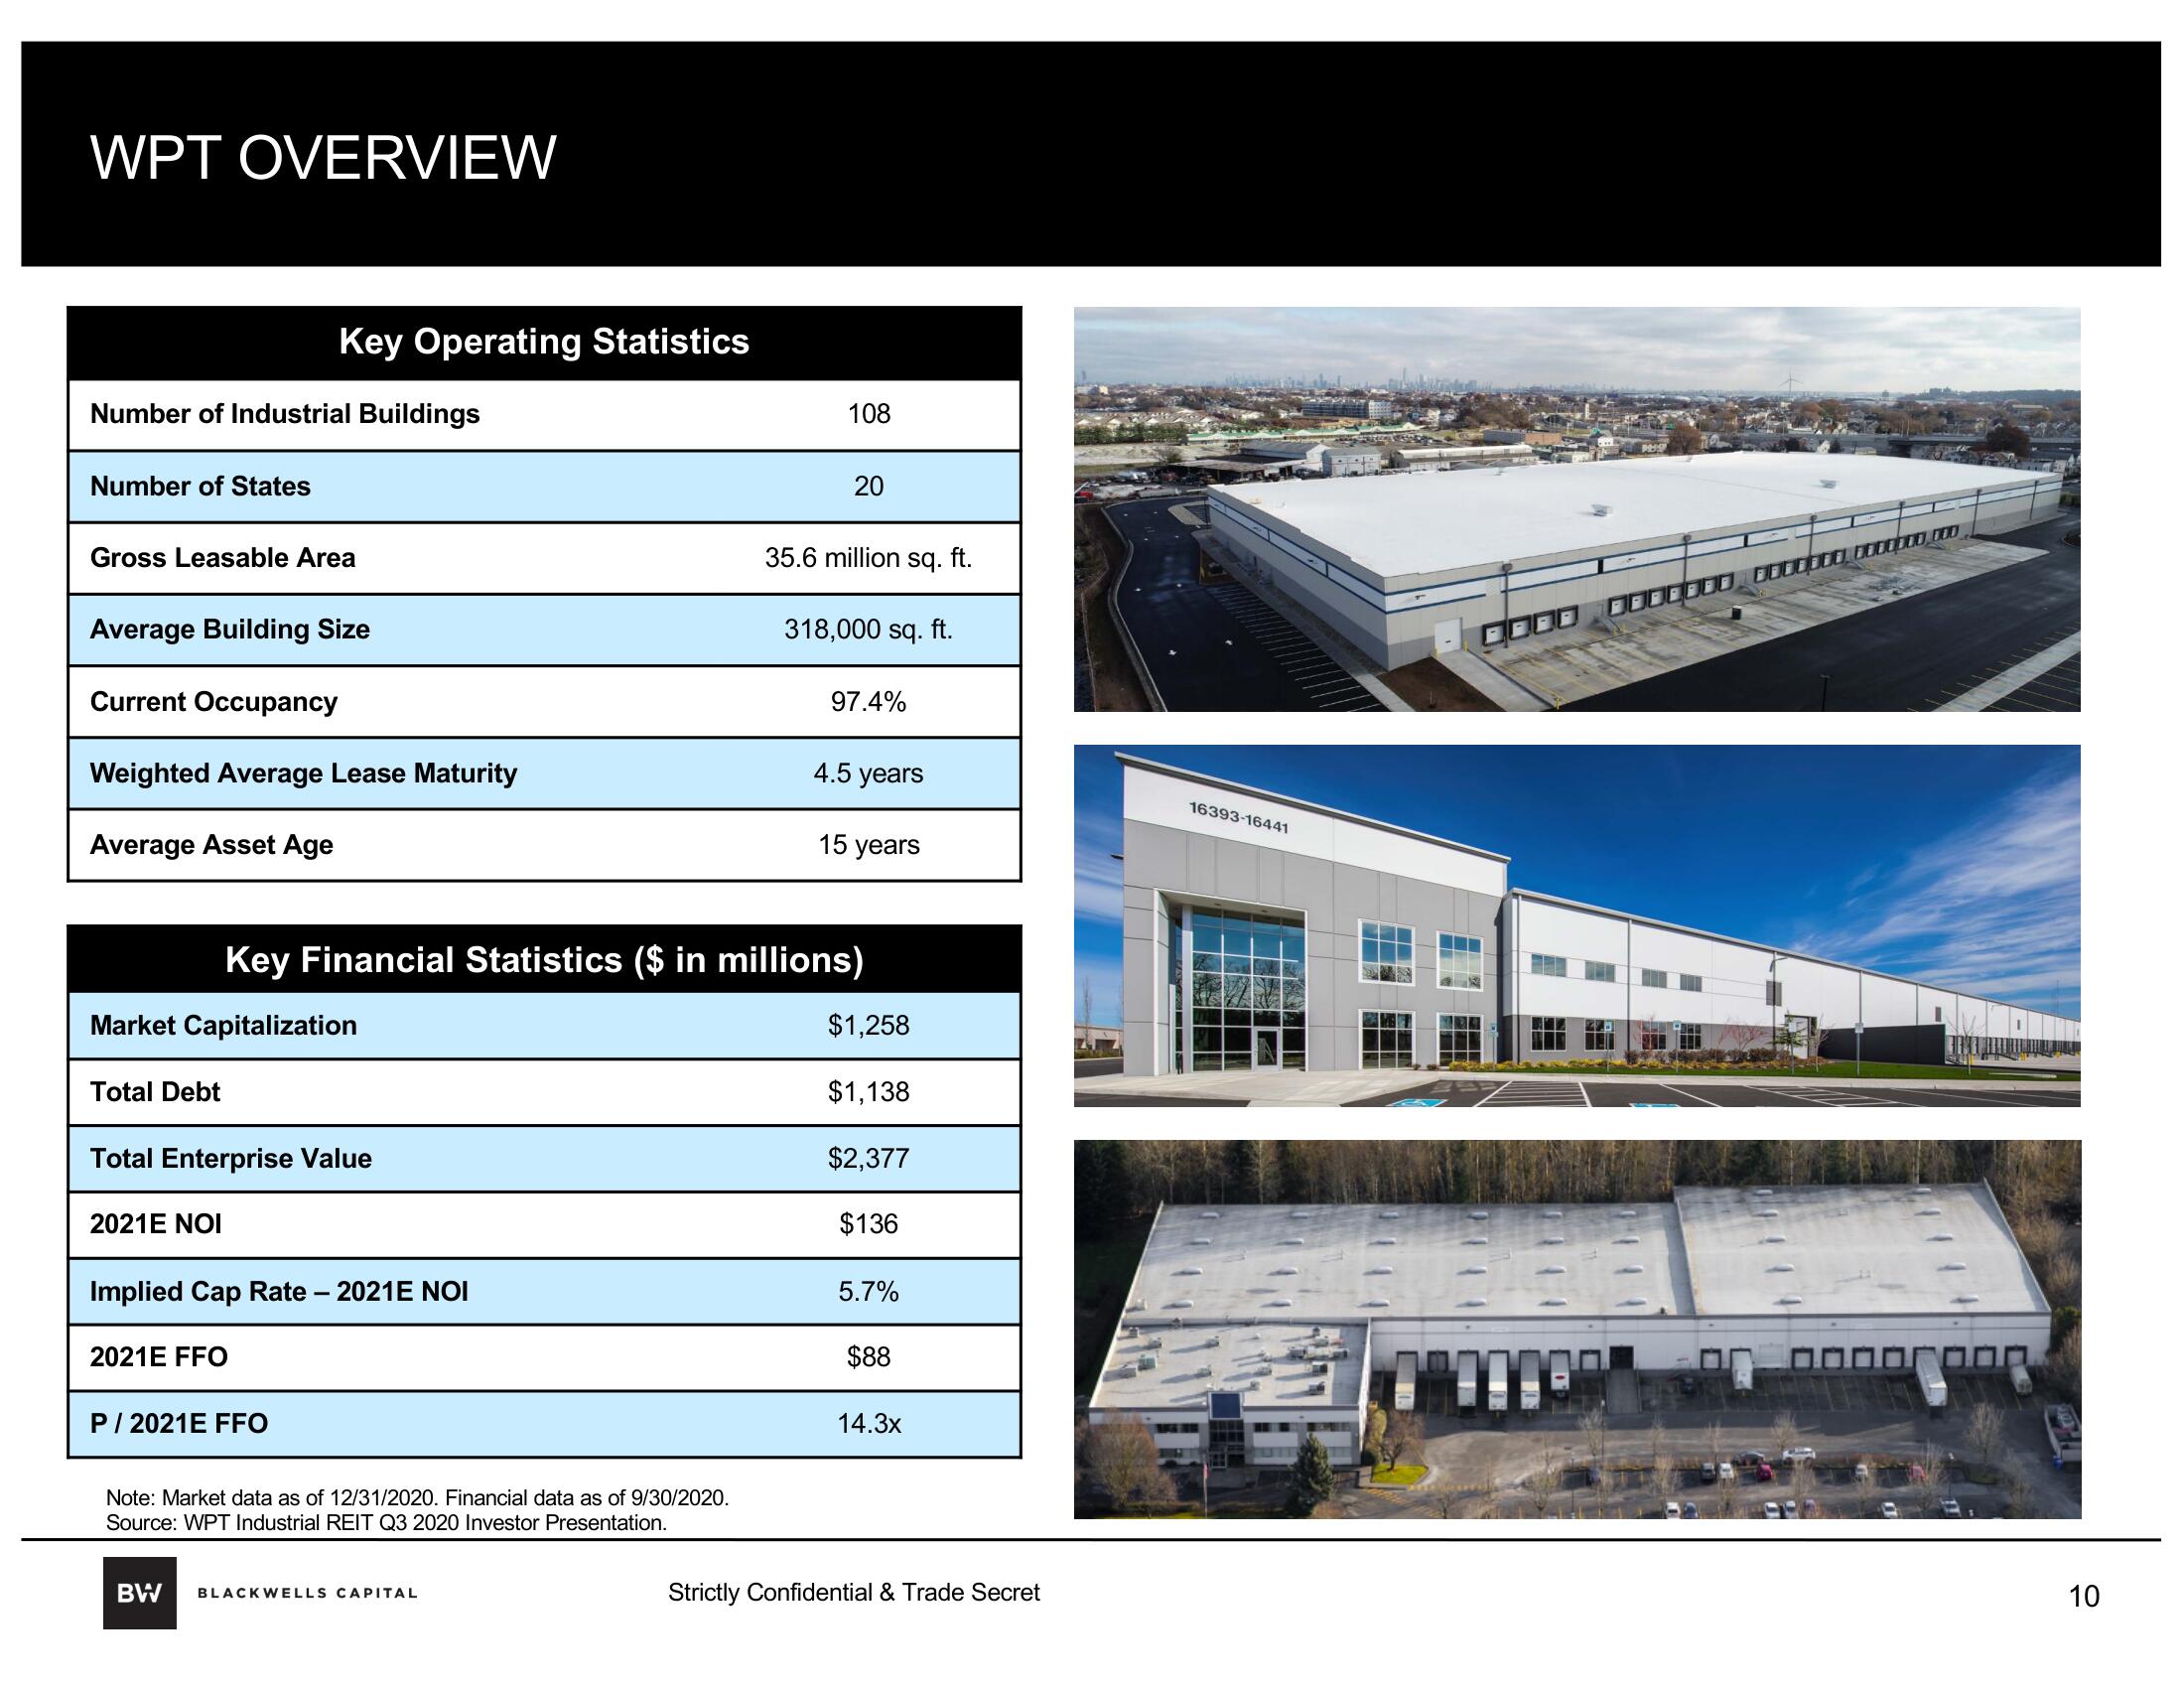
WPT OVERVIEW Number of Industrial Buildings Number of States Gross Leasable Area Average Building Size Current Occupancy Weighted Average Lease Maturity Average Asset Age Key Operating Statistics Total Debt Market Capitalization 2021E NOI Total Enterprise Value Implied Cap Rate - 2021E NOI 2021E FFO P/2021E FFO Key Financial Statistics ($ in millions) Note: Market data as of 12/31/2020. Financial data as of 9/30/2020. Source: WPT Industrial REIT Q3 2020 Investor Presentation. 108 BW BLACKWELLS CAPITAL 20 35.6 million sq. ft. 318,000 sq. ft. 97.4% 4.5 years 15 years $1,258 $1,138 $2,377 $136 5.7% $88 14.3x Strictly Confidential & Trade Secret 16393-16441 DO000, DODO DOD 0.00 10
View entire presentation