Blackwells Capital Activist Presentation Deck
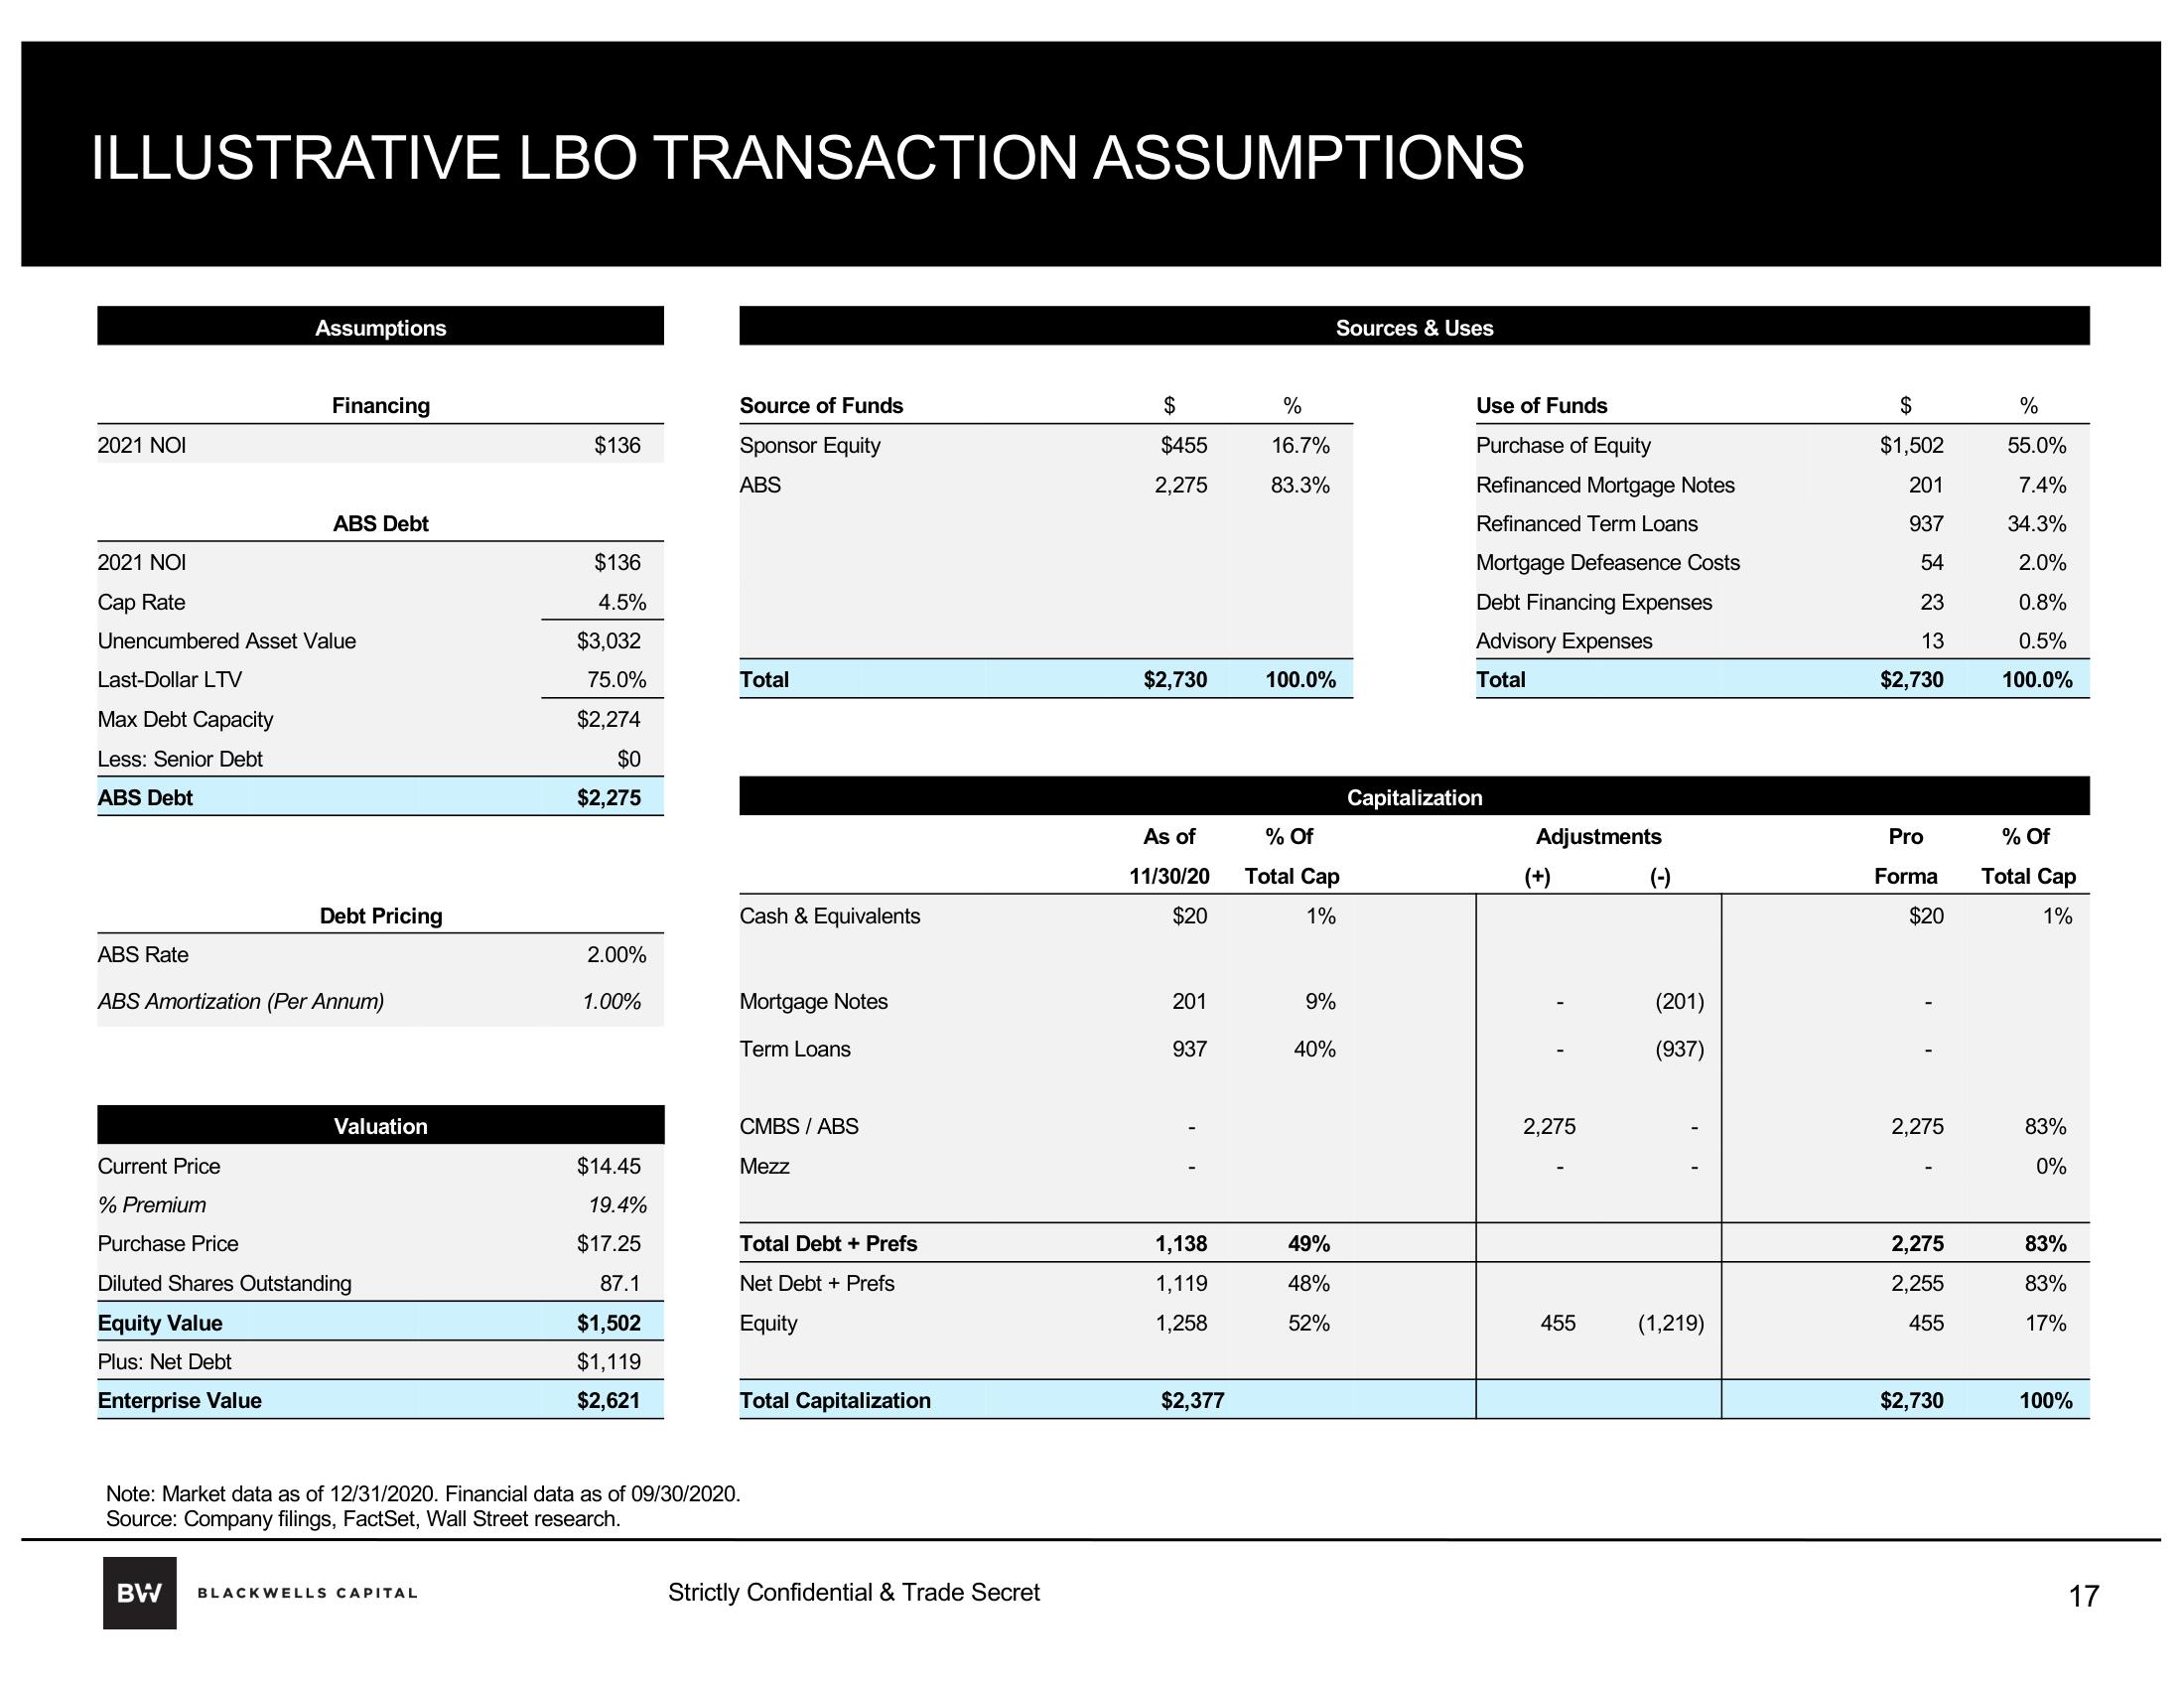
ILLUSTRATIVE LBO TRANSACTION ASSUMPTIONS
2021 NOI
Assumptions
Financing
ABS Debt
2021 NOI
Cap Rate
Unencumbered Asset Value
Last-Dollar LTV
Max Debt Capacity
Less: Senior Debt
ABS Debt
Debt Pricing
ABS Rate
ABS Amortization (Per Annum)
Valuation
Current Price
% Premium
Purchase Price
Diluted Shares Outstanding
Equity Value
Plus: Net Debt
Enterprise Value
$136
BW BLACKWELLS CAPITAL
$136
4.5%
$3,032
75.0%
$2,274
$0
$2,275
2.00%
1.00%
$14.45
19.4%
$17.25
87.1
$1,502
$1,119
$2,621
Source of Funds
Sponsor Equity
ABS
Total
Cash & Equivalents
Mortgage Notes
Term Loans
CMBS / ABS
Mezz
Total Debt + Prefs
Net Debt + Prefs
Equity
Total Capitalization
Note: Market data as of 12/31/2020. Financial data as of 09/30/2020.
Source: Company filings, FactSet, Wall Street research.
Strictly Confidential & Trade Secret
$
$455
2,275
$2,730
As of
11/30/20
$20
201
937
1,138
1,119
1,258
$2,377
%
16.7%
83.3%
100.0%
% Of
Total Cap
1%
9%
40%
Sources & Uses
49%
48%
52%
Use of Funds
Purchase of Equity
Refinanced Mortgage Notes
Refinanced Term Loans
Mortgage Defeasence Costs
Debt Financing Expenses
Advisory Expenses
Total
Capitalization
Adjustments
(+)
2,275
455
(-)
(201)
(937)
(1,219)
$
$1,502
201
937
54
23
13
$2,730
Pro
Forma
$20
2,275
2,275
2,255
455
$2,730
%
55.0%
7.4%
34.3%
2.0%
0.8%
0.5%
100.0%
% Of
Total Cap
1%
83%
0%
83%
83%
17%
100%
17View entire presentation