Uber Results Presentation Deck slide image

Uber Results Presentation Deck

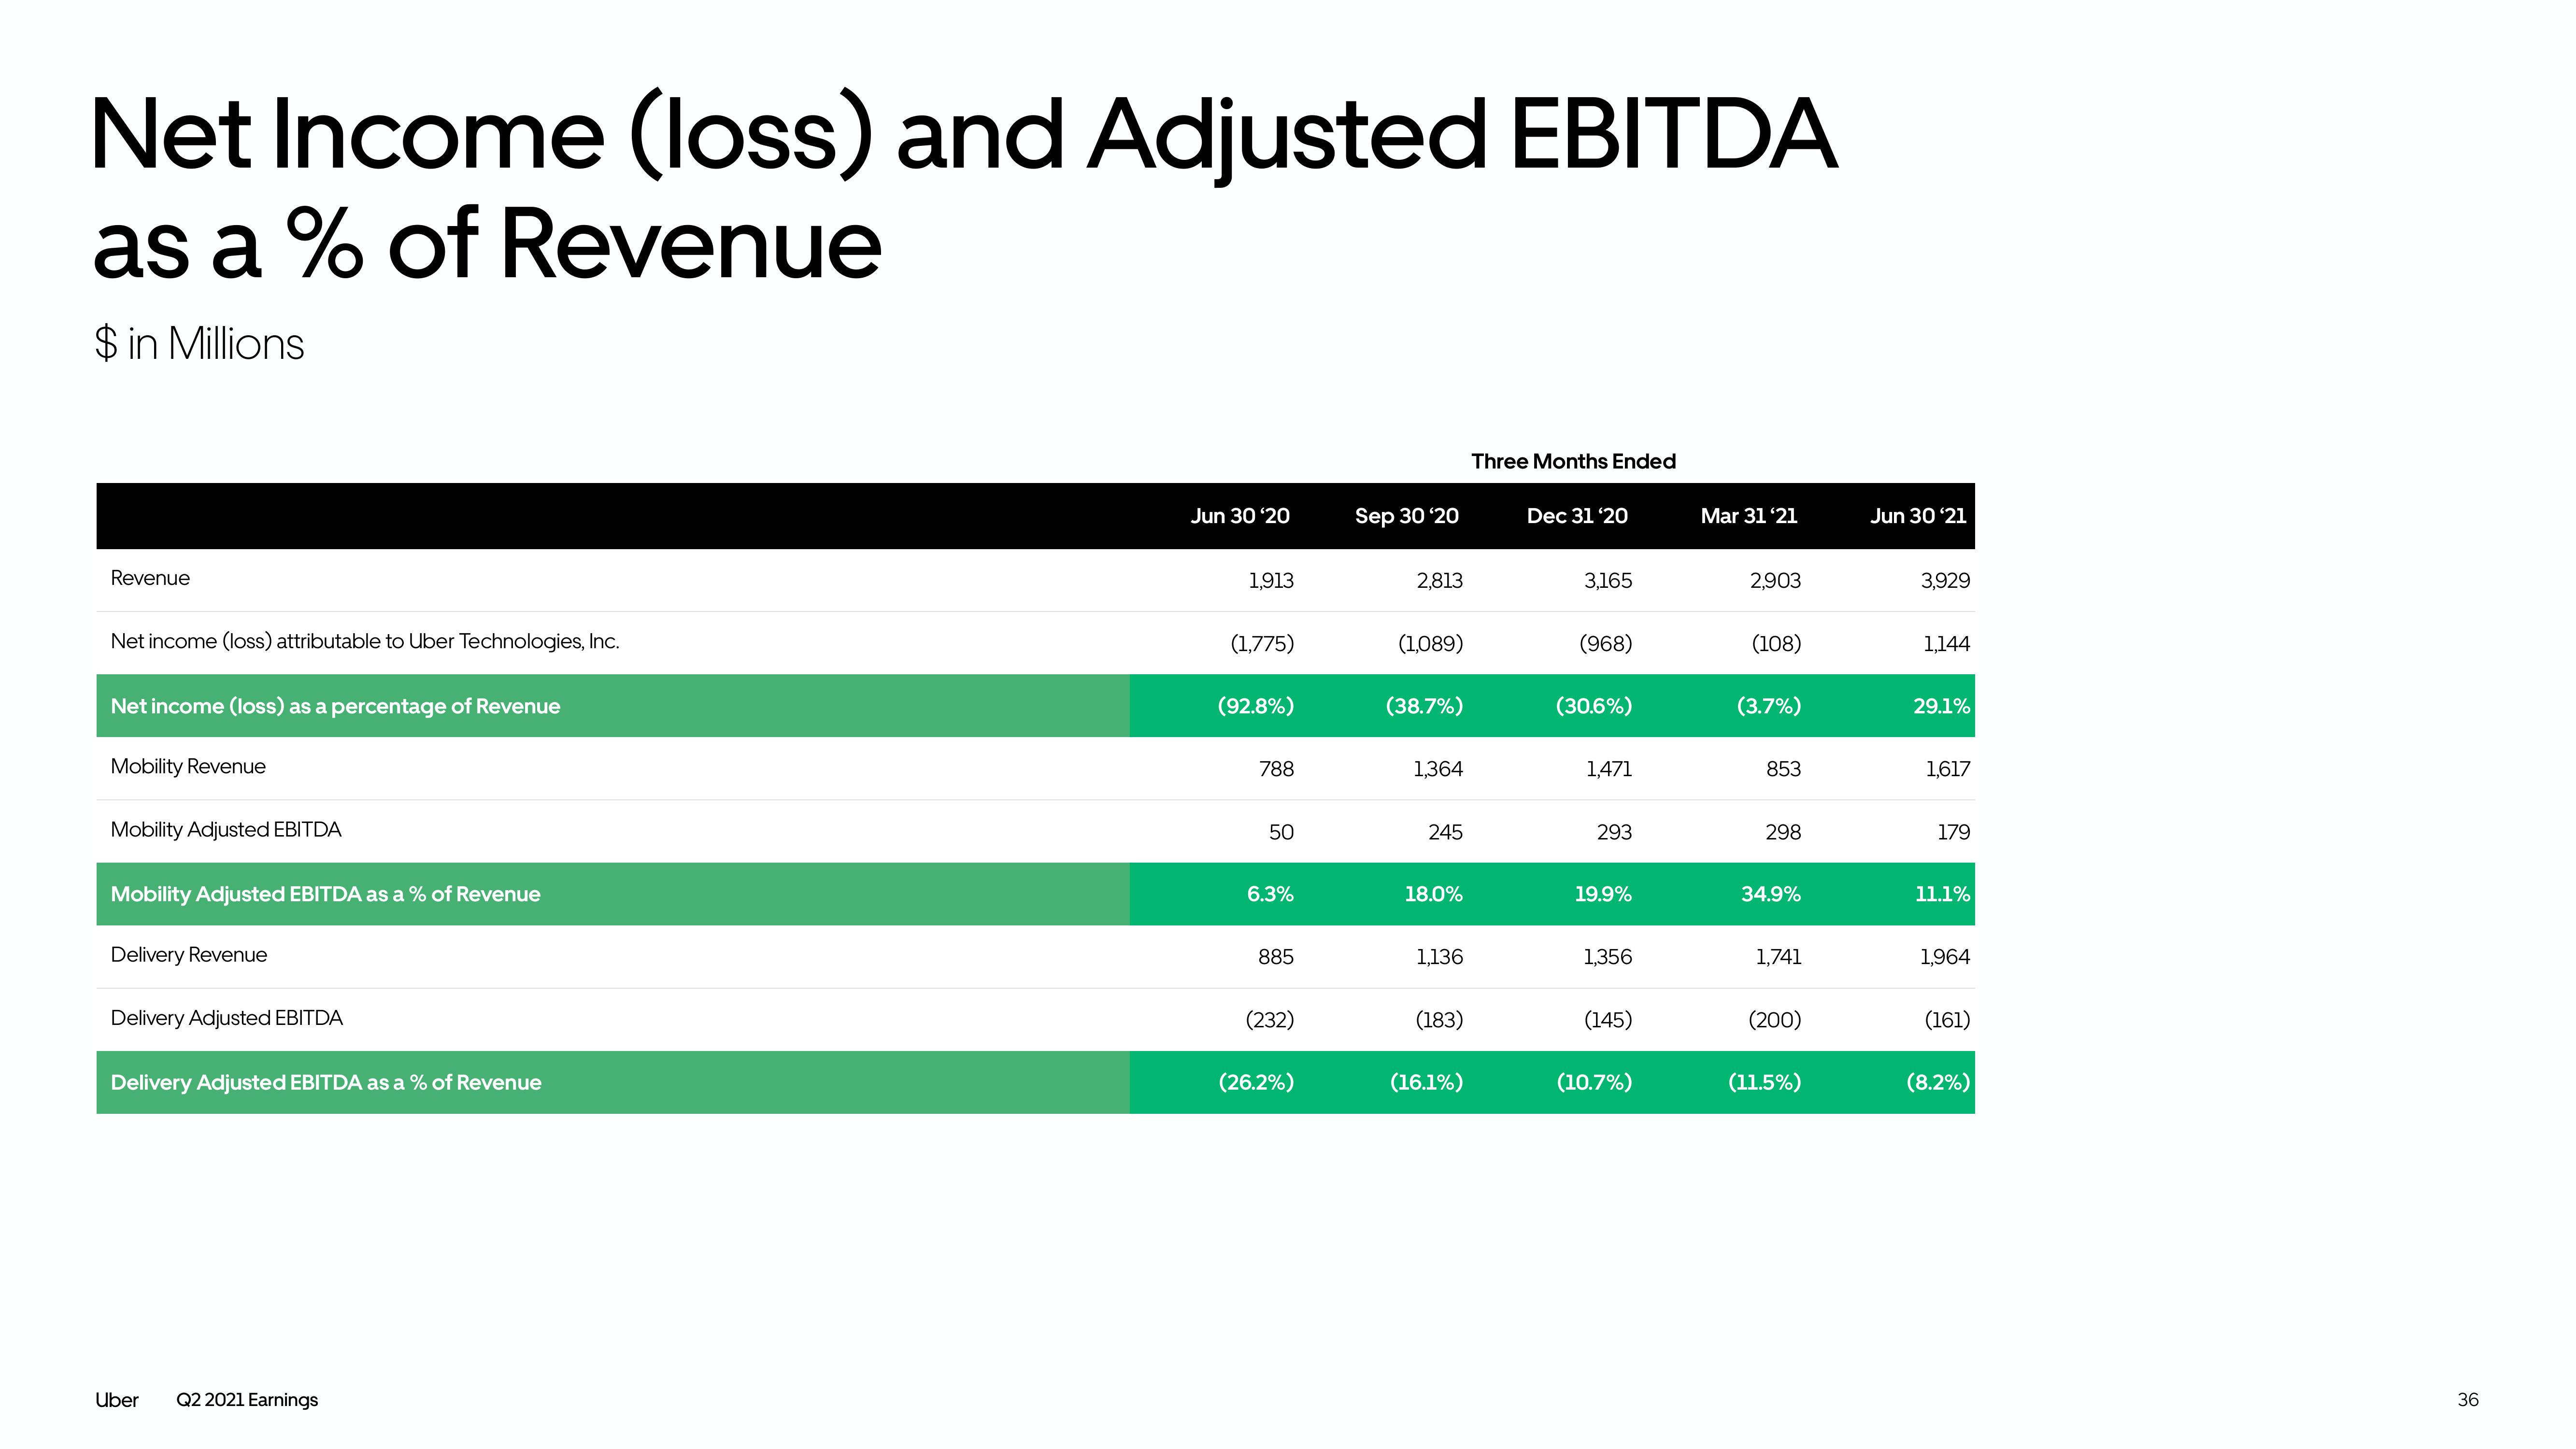
Net Income (loss) and Adjusted EBITDA as a % of Revenue $ in Millions Revenue Net income (loss) attributable to Uber Technologies, Inc. Net income (loss) as a percentage of Revenue Mobility Revenue Mobility Adjusted EBITDA Mobility Adjusted EBITDA as a % of Revenue Delivery Revenue Delivery Adjusted EBITDA Delivery Adjusted EBITDA as a % of Revenue Uber Q2 2021 Earnings Jun 30'20 1,913 (1,775) (92.8%) 788 50 6.3% 885 (232) (26.2%) Sep 30 '20 2,813 (1,089) (38.7%) 1,364 245 18.0% 1.136 (183) (16.1%) Three Months Ended Dec 31'20 3,165 (968) (30.6%) 1,471 293 19.9% 1,356 (145) (10.7%) Mar 31'21 2,903 (108) (3.7%) 853 298 34.9% 1,741 (200) (11.5%) Jun 30 '21 3,929 1,144 29.1% 1,617 179 11.1% 1,964 (161) (8.2%) 36
View entire presentation