Grab Results Presentation Deck
Business Update
Improving platform efficiency
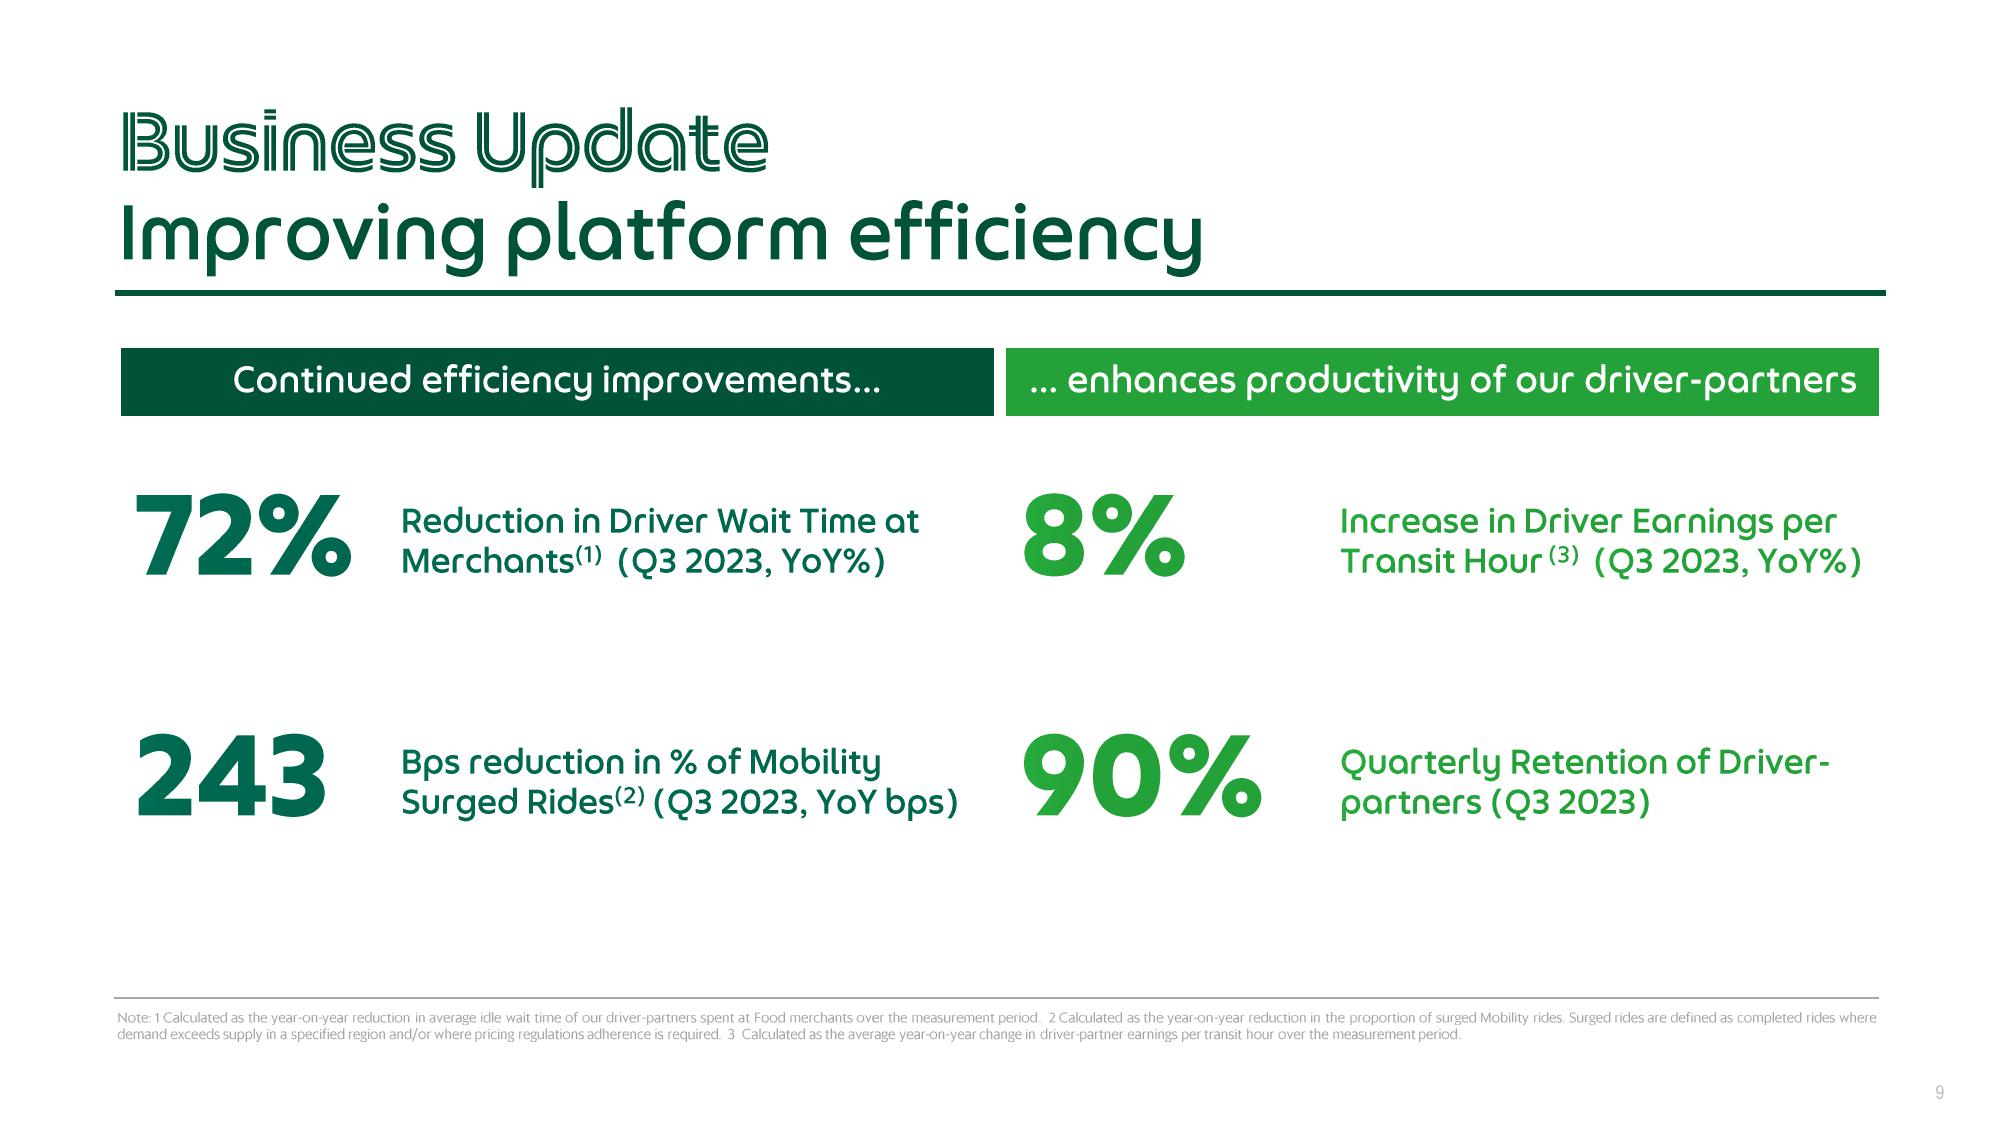
Continued efficiency improvements...
72%
243
Reduction in Driver Wait Time at
Merchants(¹) (Q3 2023, YOY%)
Bps reduction in % of Mobility
Surged Rides(2) (Q3 2023, YOY bps)
... enhances productivity of our driver-partners
8%
90%
Increase in Driver Earnings per
Transit Hour (3) (Q3 2023, YOY%)
Quarterly Retention of Driver-
partners (Q3 2023)
Note: 1 Calculated as the year-on-year reduction in average idle wait time of our driver-partners spent at Food merchants over the measurement period. 2 Calculated as the year-on-year reduction in the proportion of surged Mobility rides. Surged rides are defined as completed rides where
demand exceeds supply in a specified region and/or where pricing regulations adherence is required. 3 Calculated as the average year-on-year change in driver-partner earnings per transit hour over the measurement period.
9View entire presentation