Goldman Sachs Results Presentation Deck
Financial Overview
$ in millions,
except per share amounts
Global Banking & Markets
Asset & Wealth Management
Platform Solutions
Net revenues
Provision for credit losses
Operating expenses
Pre-tax earnings $
Net earnings
Net earnings to common $
Diluted EPS $
ROE¹
ROTE¹
Efficiency Ratio³
Financial Results
2Q23
7,189
3,047
659
10,895
615
8,544
1,736
1,216
1,071
3.08
4.0%
4.4%
78.4%
VS.
1Q23
(15)%
(5)%
17%
(11)%
N.M.
2%
(57)%
(62)%
(65)%
(65)%
(7.6)pp
(8.2)pp
9.7pp
VS.
2Q22
(14)%$
(4)%
92%
(8)%
(8)%
12%
(58)%$
2Q23
YTD
15,633
13.9pp
6,263
1,223
23,119
444
(51) % $ 5,729
16,946
4,450
(62)% $ 4,158
(60)% $ 11.91
(6.6)pp
(7.0)pp
7.8%
8.5%
73.3%
VS.
2Q22
YTD
(15)%
8%
100%
(7)%
(64)%
10%
(30)%
(35)%
(37)%
(36)%
(5.0)pp
(5.1)pp
11.3pp
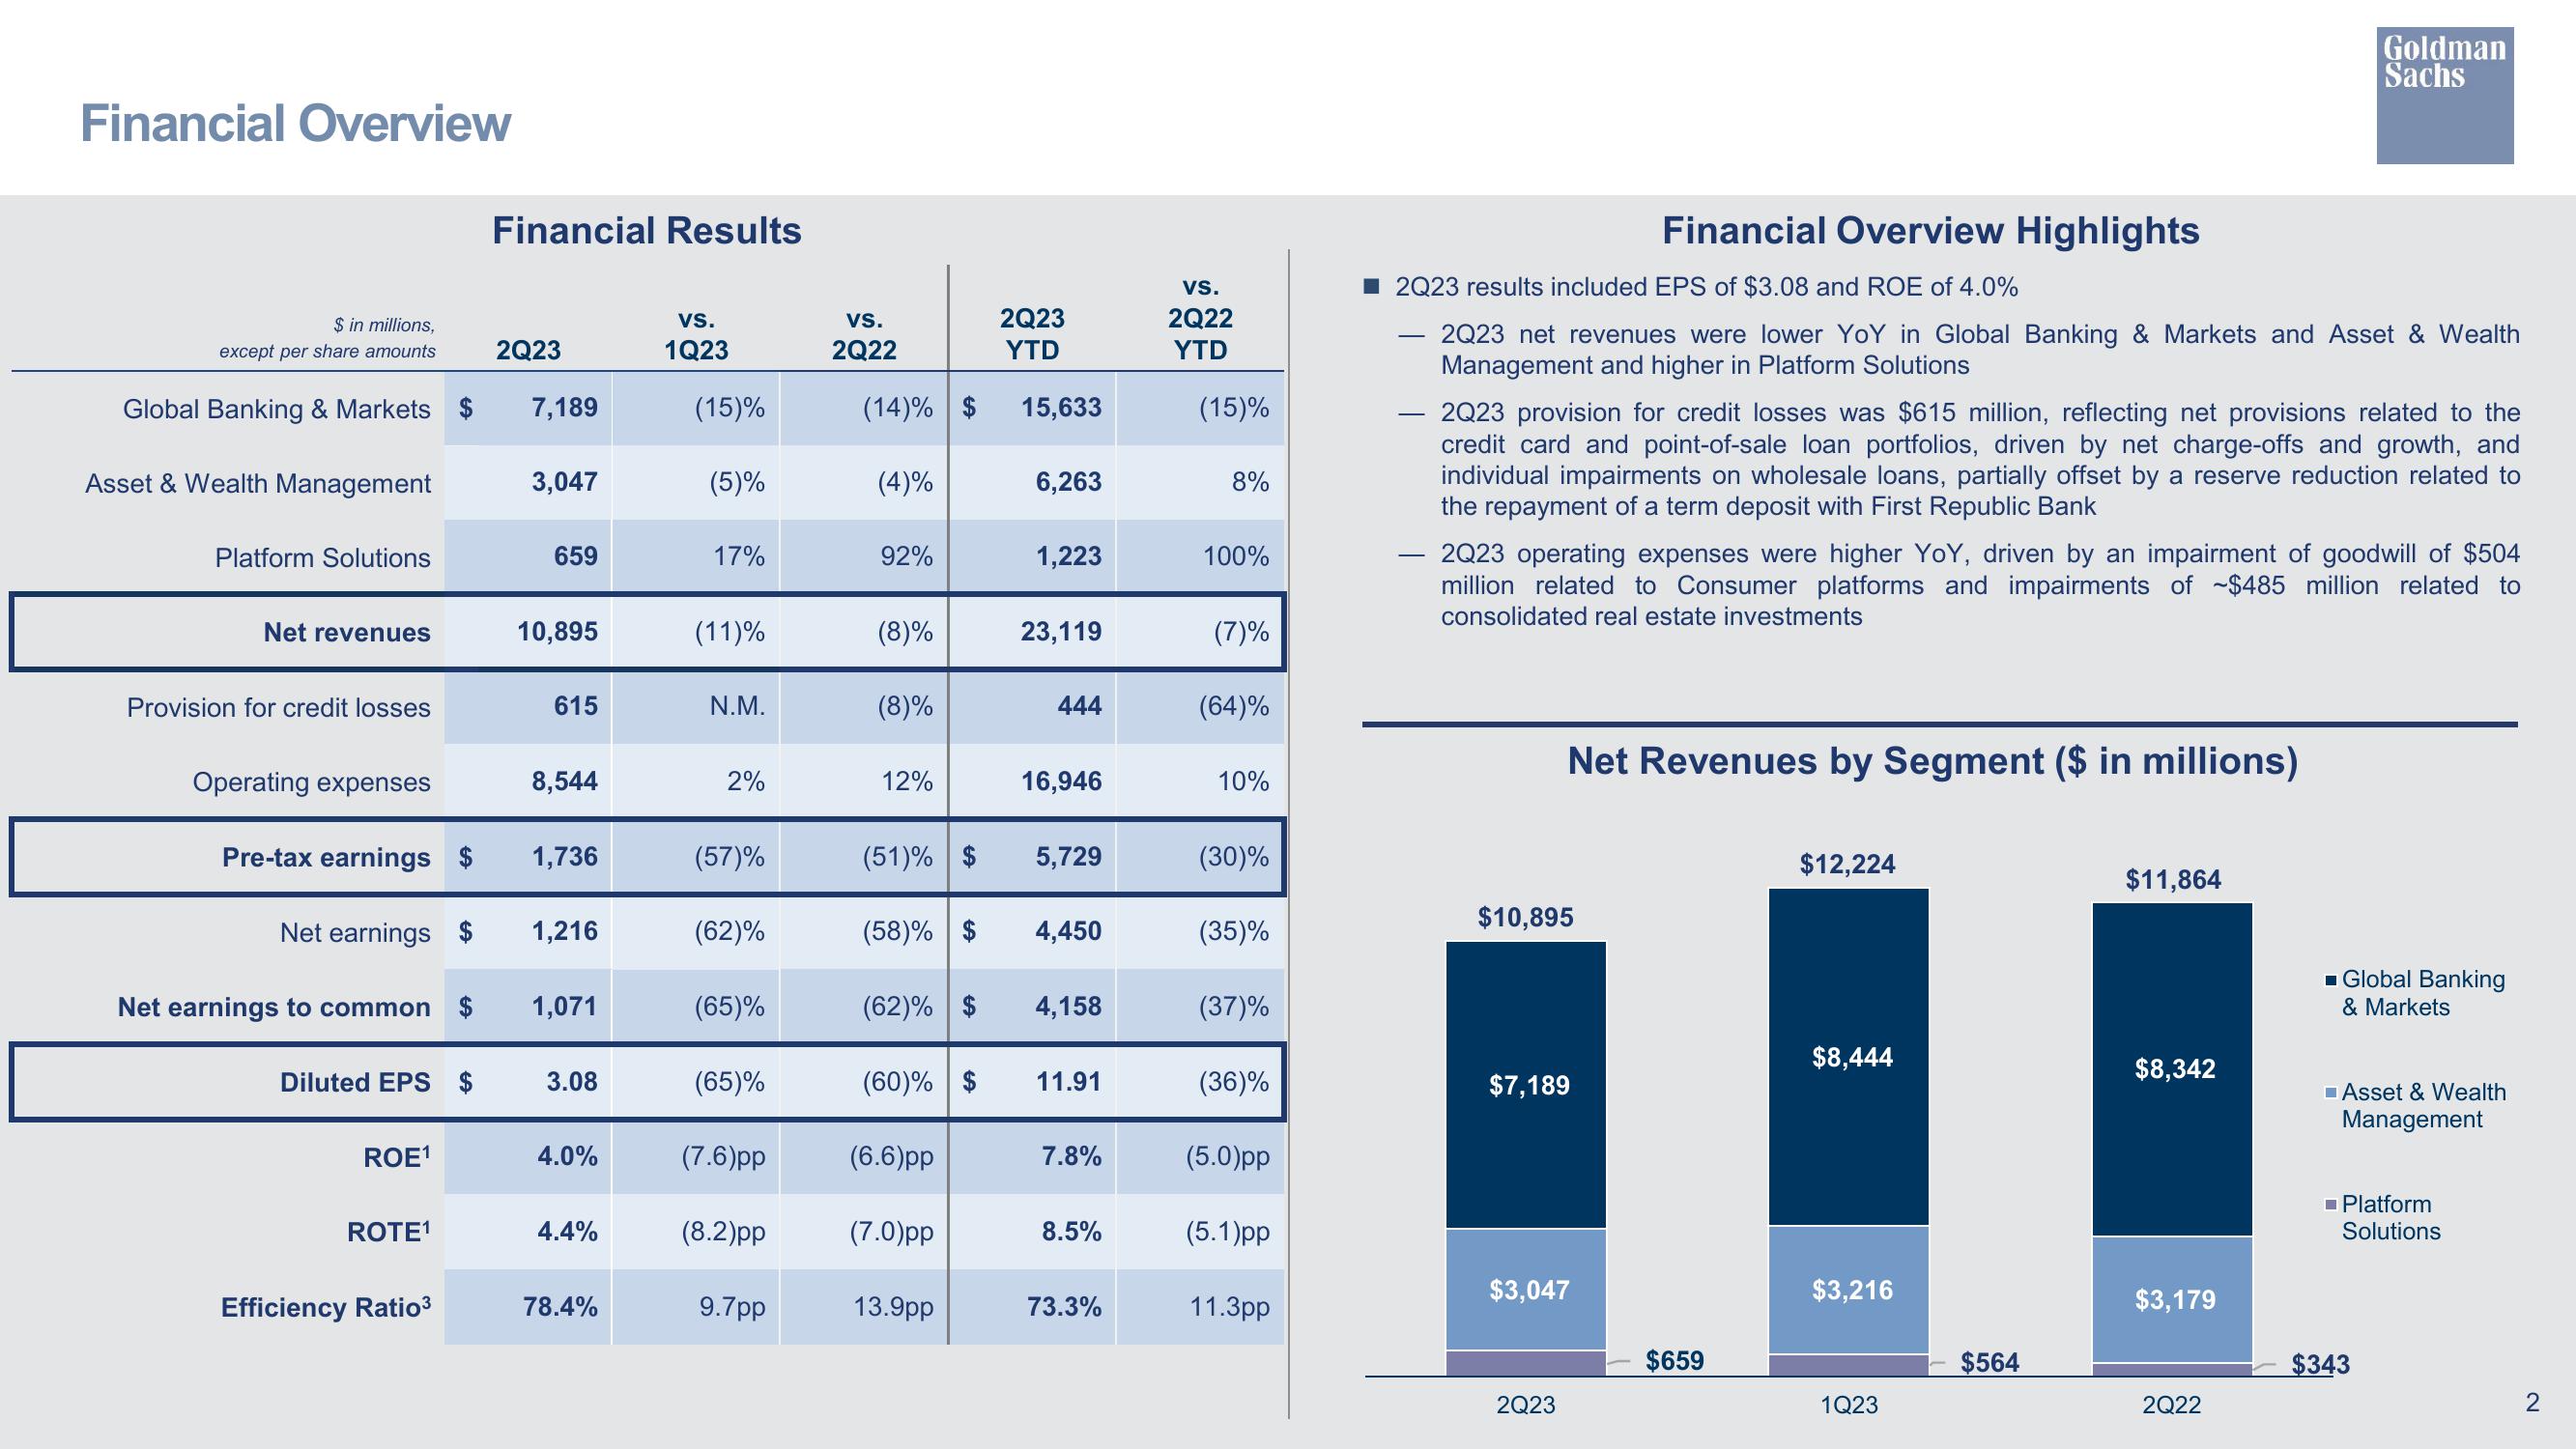
■2Q23 results included EPS of $3.08 and ROE of 4.0%
2Q23 net revenues were lower YoY in Global Banking & Markets and Asset & Wealth
Management and higher in Platform Solutions
2Q23 provision for credit losses was $615 million, reflecting net provisions related to the
credit card and point-of-sale loan portfolios, driven by net charge-offs and growth, and
individual impairments on wholesale loans, partially offset by a reserve reduction related to
the repayment of a term deposit with First Republic Bank
Financial Overview Highlights
2Q23 operating expenses were higher YoY, driven by an impairment of goodwill of $504
million related to Consumer platforms and impairments of $485 million related to
consolidated real estate investments
$10,895
Net Revenues by Segment ($ in millions)
$7,189
$3,047
2Q23
$659
$12,224
$8,444
$3,216
1Q23
$564
$11,864
$8,342
Goldman
Sachs
$3,179
2Q22
■ Global Banking
& Markets
Asset & Wealth
Management
■Platform
Solutions
$343
2View entire presentation