Sonos Results Presentation Deck
Fiscal 2022 Financial Summary
$1,752
CC: +5%
Reported: +2%
NET REVENUE
$1,261
FY2019
$89
$1,326
ADJUSTED EBITDA
FY2019
FY2020
$109
FY2020
$1,717
FY2021
$279
FY2021
FY2022
$227
-19%
FY2022
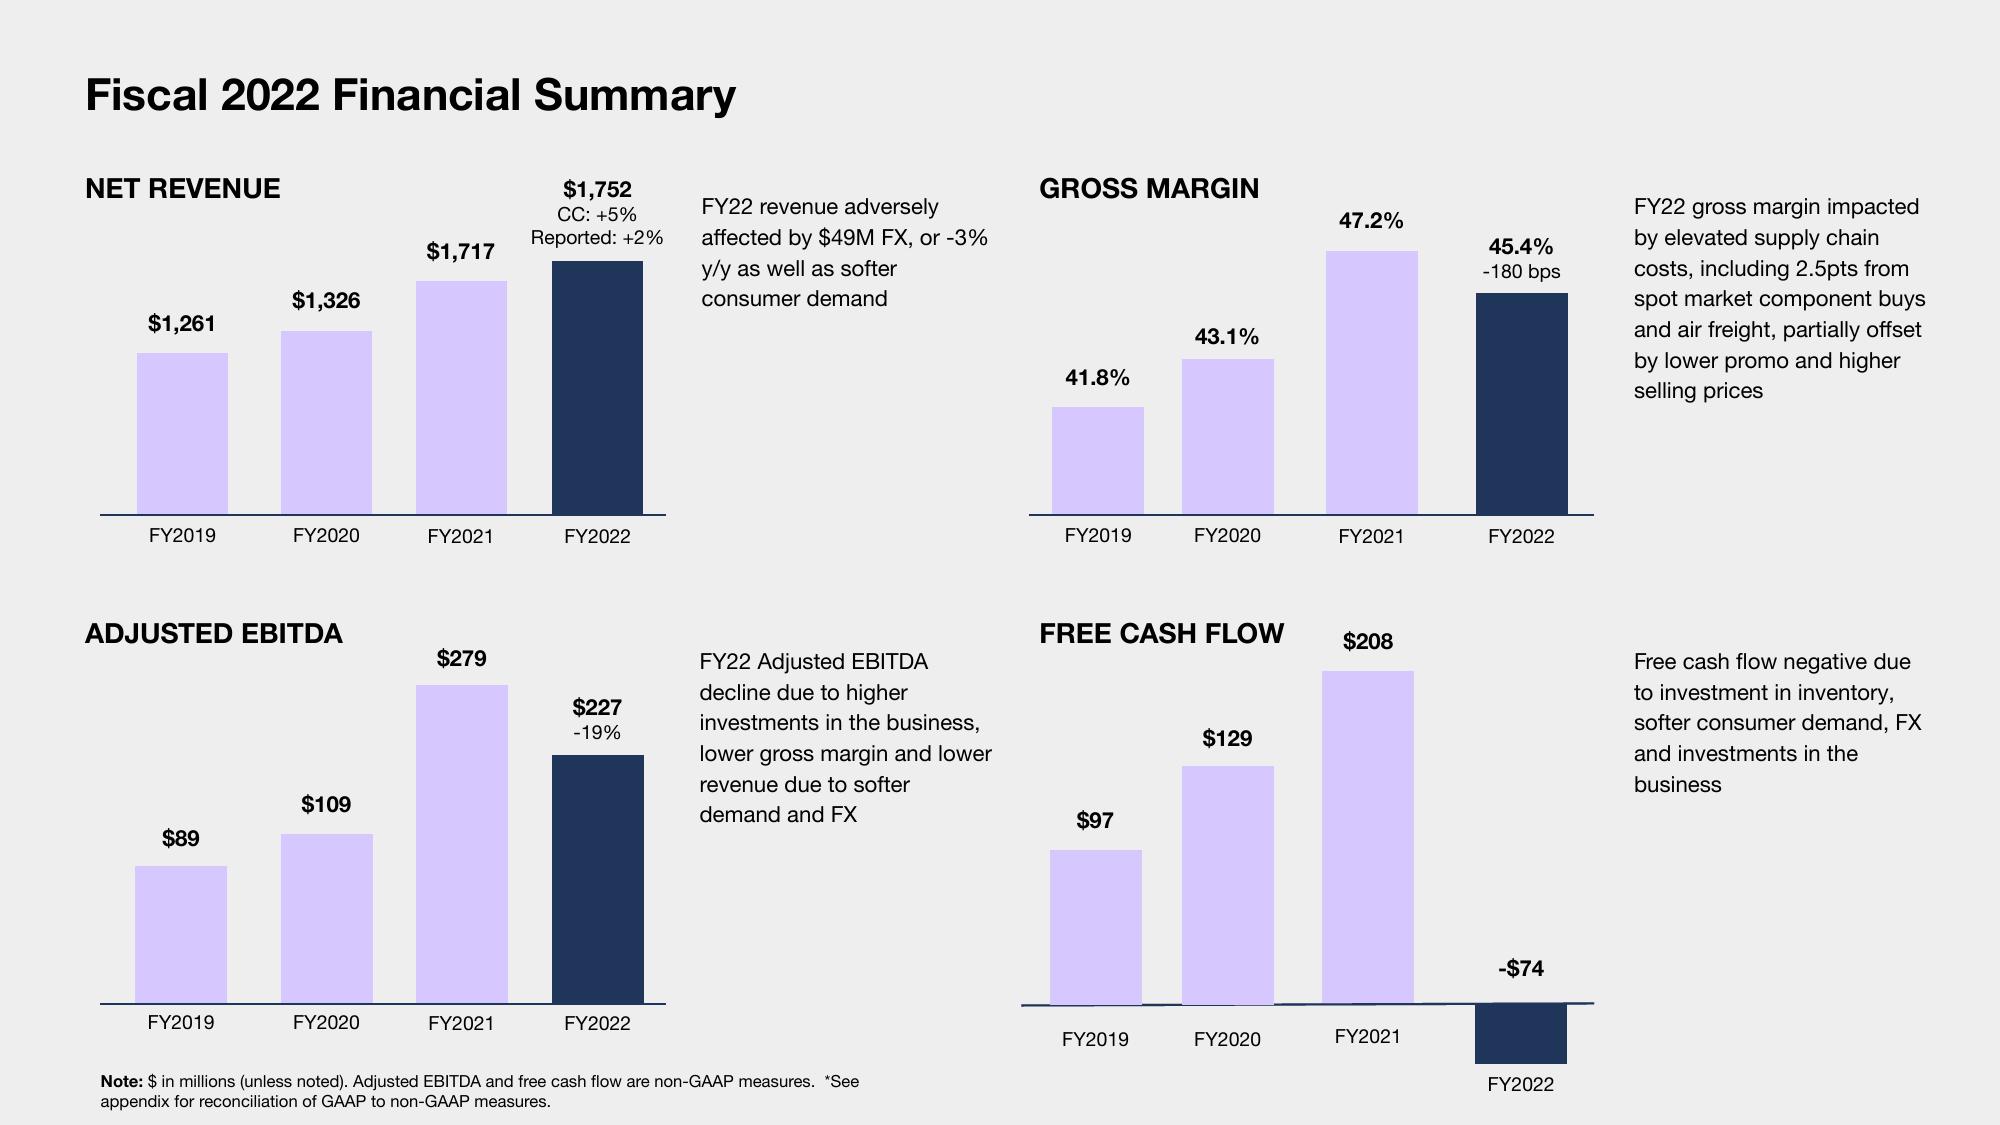
FY22 revenue adversely
affected by $49M FX, or -3%
y/y as well as softer
consumer demand
FY22 Adjusted EBITDA
decline due to higher
investments in the business,
lower gross margin and lower
revenue due to softer
demand and FX
Note: $ in millions (unless noted). Adjusted EBITDA and free cash flow are non-GAAP measures. "See
appendix for reconciliation of GAAP to non-GAAP measures.
GROSS MARGIN
41.8%
FY2019
$97
43.1%
FREE CASH FLOW
FY2019
FY2020
$129
FY2020
47.2%
FY2021
$208
FY2021
45.4%
-180 bps
FY2022
-$74
FY2022
FY22 gross margin impacted
by elevated supply chain
costs, including 2.5pts from
spot market component buys
and air freight, partially offset
by lower promo and higher
selling prices
Free cash flow negative due
to investment in inventory,
softer consumer demand, FX
and investments in the
businessView entire presentation