Ocado Results Presentation Deck
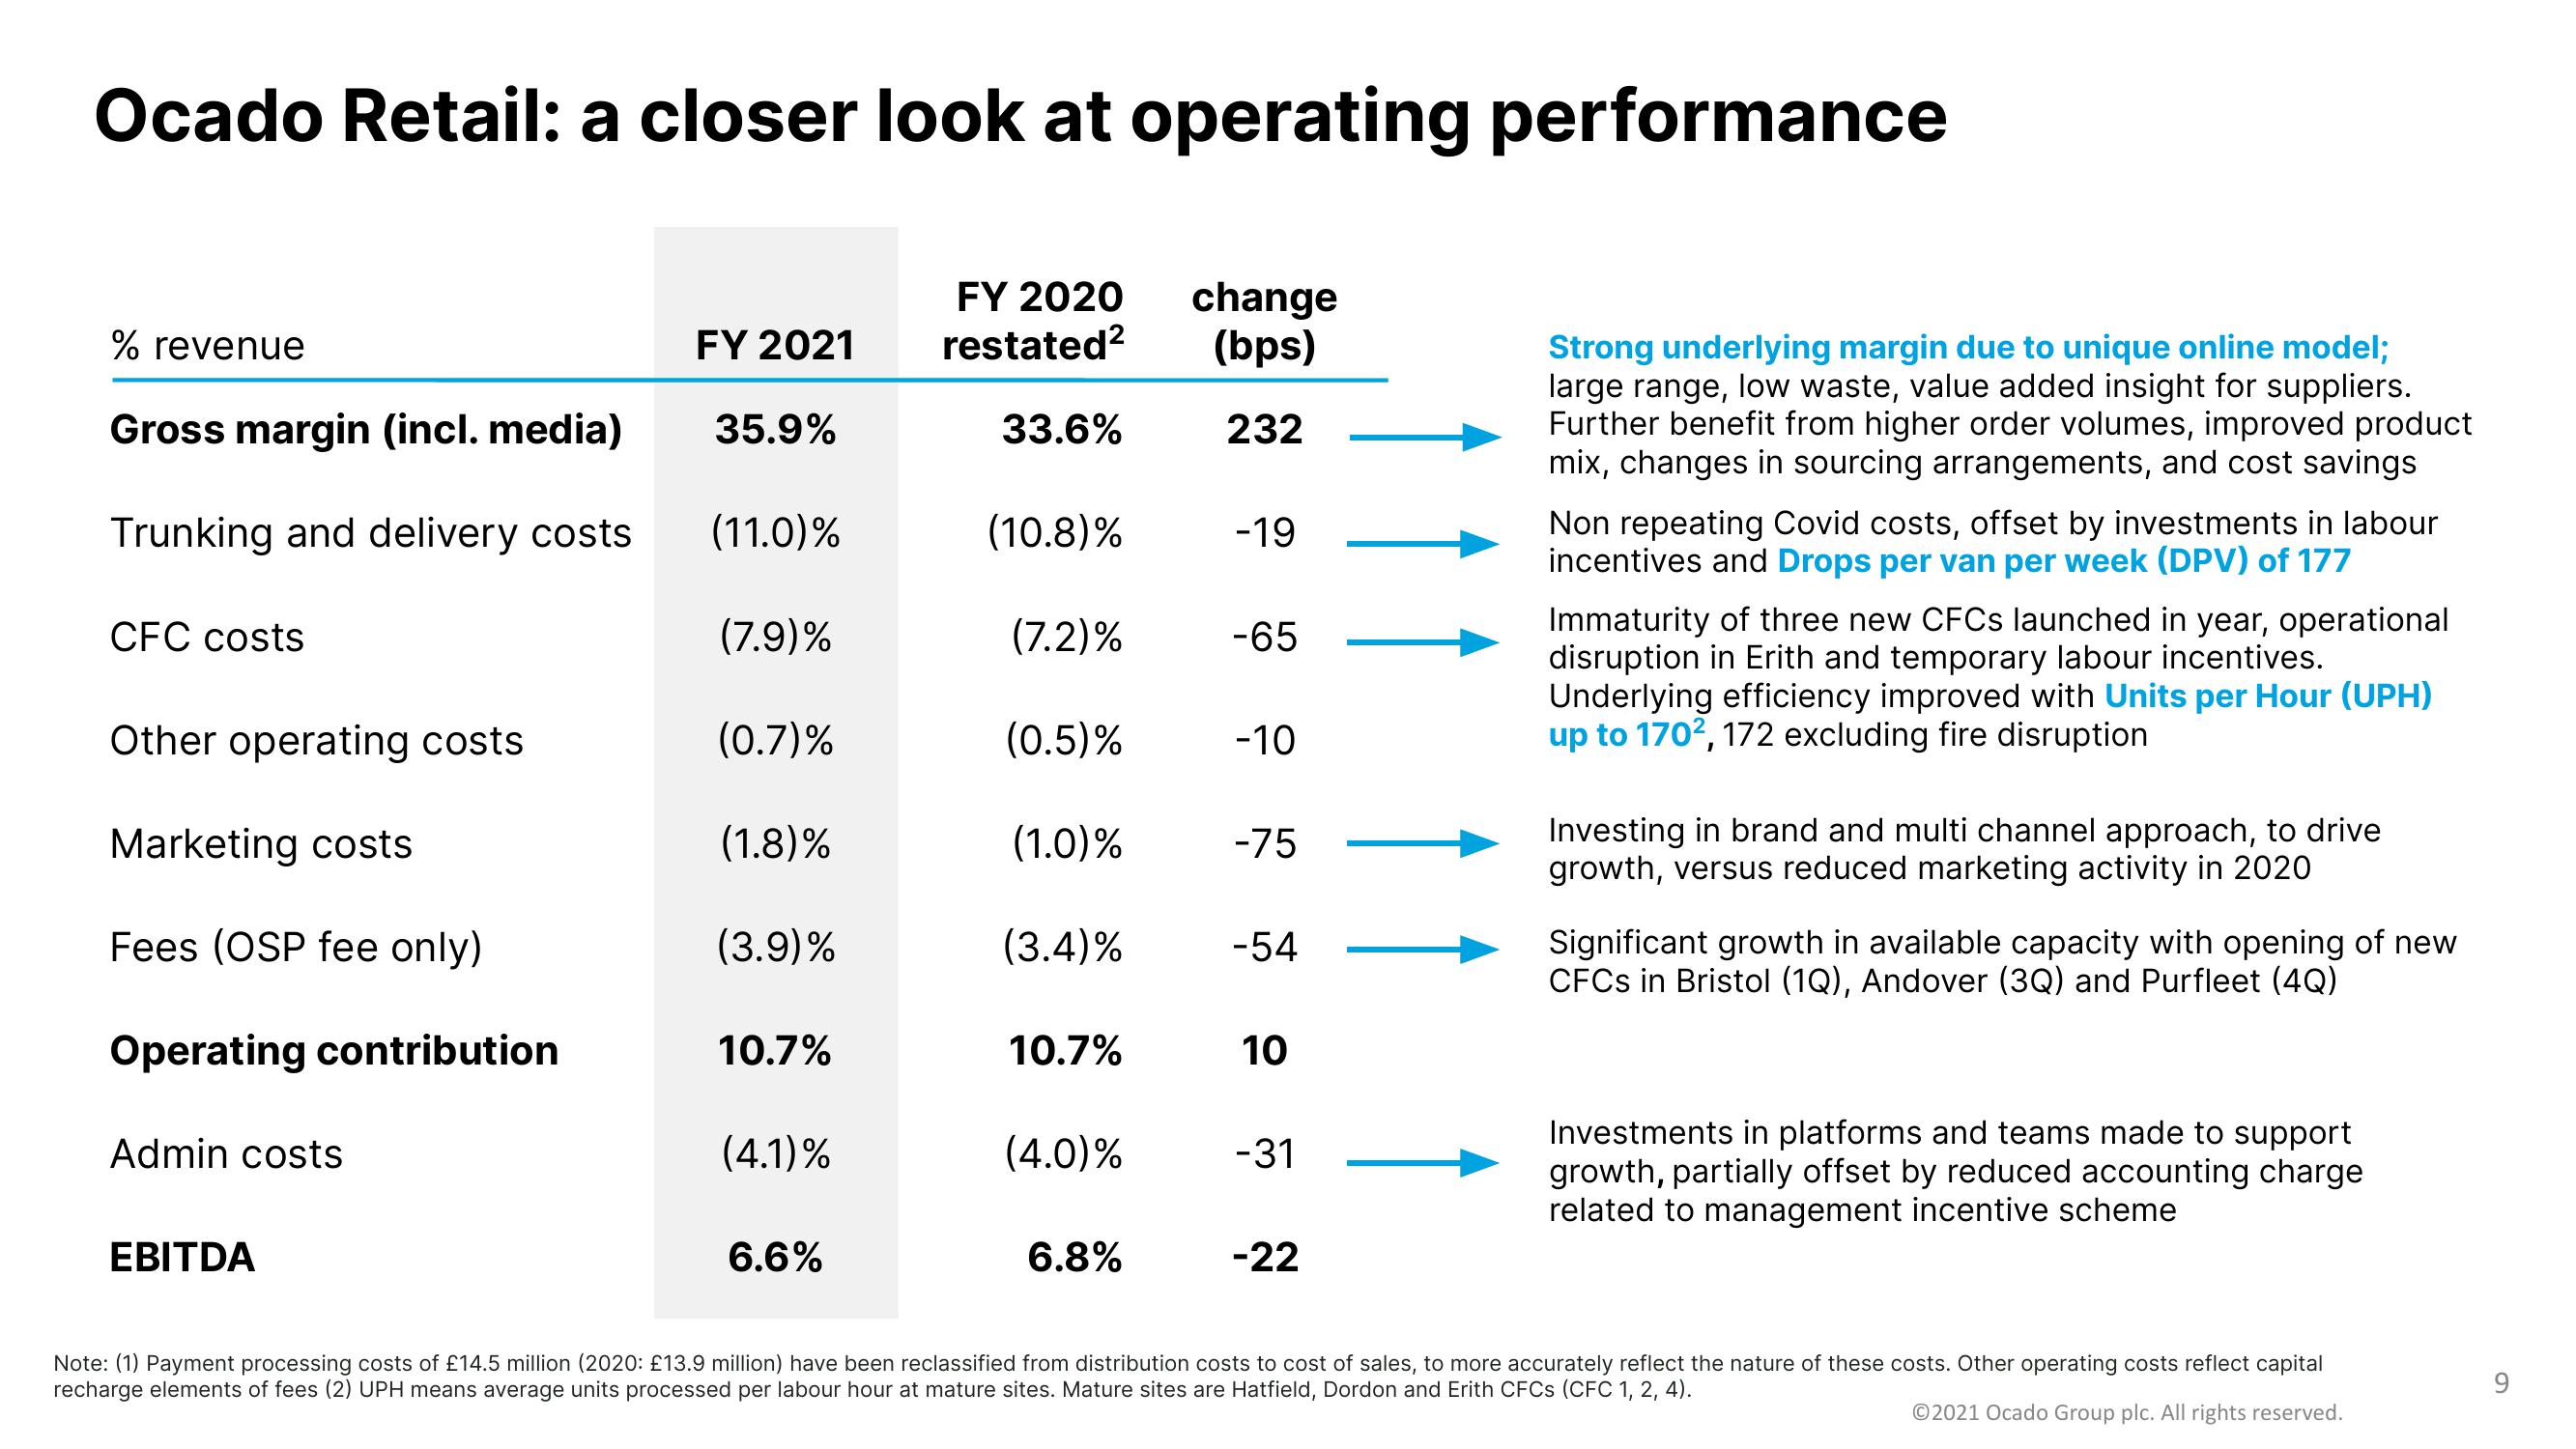
Ocado Retail: a closer look at operating performance
FY 2020 change
restated² (bps)
232
% revenue
Gross margin (incl. media)
Trunking and delivery costs
CFC costs
Other operating costs
Marketing costs
Fees (OSP fee only)
Operating contribution
Admin costs
EBITDA
FY 2021
35.9%
(11.0)%
(7.9)%
(0.7)%
(1.8)%
(3.9)%
10.7%
(4.1)%
6.6%
33.6%
(10.8)%
(7.2)%
(0.5)%
(1.0)%
(3.4)%
10.7%
(4.0)%
6.8%
-19
-65
-10
-75
-54
10
-31
-22
Strong underlying margin due to unique online model;
large range, low waste, value added insight for suppliers.
Further benefit from higher order volumes, improved product
mix, changes in sourcing arrangements, and cost savings
Non repeating Covid costs, offset by investments in labour
incentives and Drops per van per week (DPV) of 177
Immaturity of three new CFCs launched in year, operational
disruption in Erith and temporary labour incentives.
Underlying efficiency improved with Units per Hour (UPH)
up to 170², 172 excluding fire disruption
Investing in brand and multi channel approach, to drive
growth, versus reduced marketing activity in 2020
Significant growth in available capacity with opening of new
CFCs in Bristol (1Q), Andover (3Q) and Purfleet (4Q)
Investments in platforms and teams made to support
growth, partially offset by reduced accounting charge
related to management incentive scheme
Note: (1) Payment processing costs of £14.5 million (2020: £13.9 million) have been reclassified from distribution costs to cost of sales, to more accurately reflect the nature of these costs. Other operating costs reflect capital
recharge elements of fees (2) UPH means average units processed per labour hour at mature sites. Mature sites are Hatfield, Dordon and Erith CFCs (CFC 1, 2, 4).
Ⓒ2021 Ocado Group plc. All rights reserved.
9View entire presentation