Tudor, Pickering, Holt & Co Investment Banking
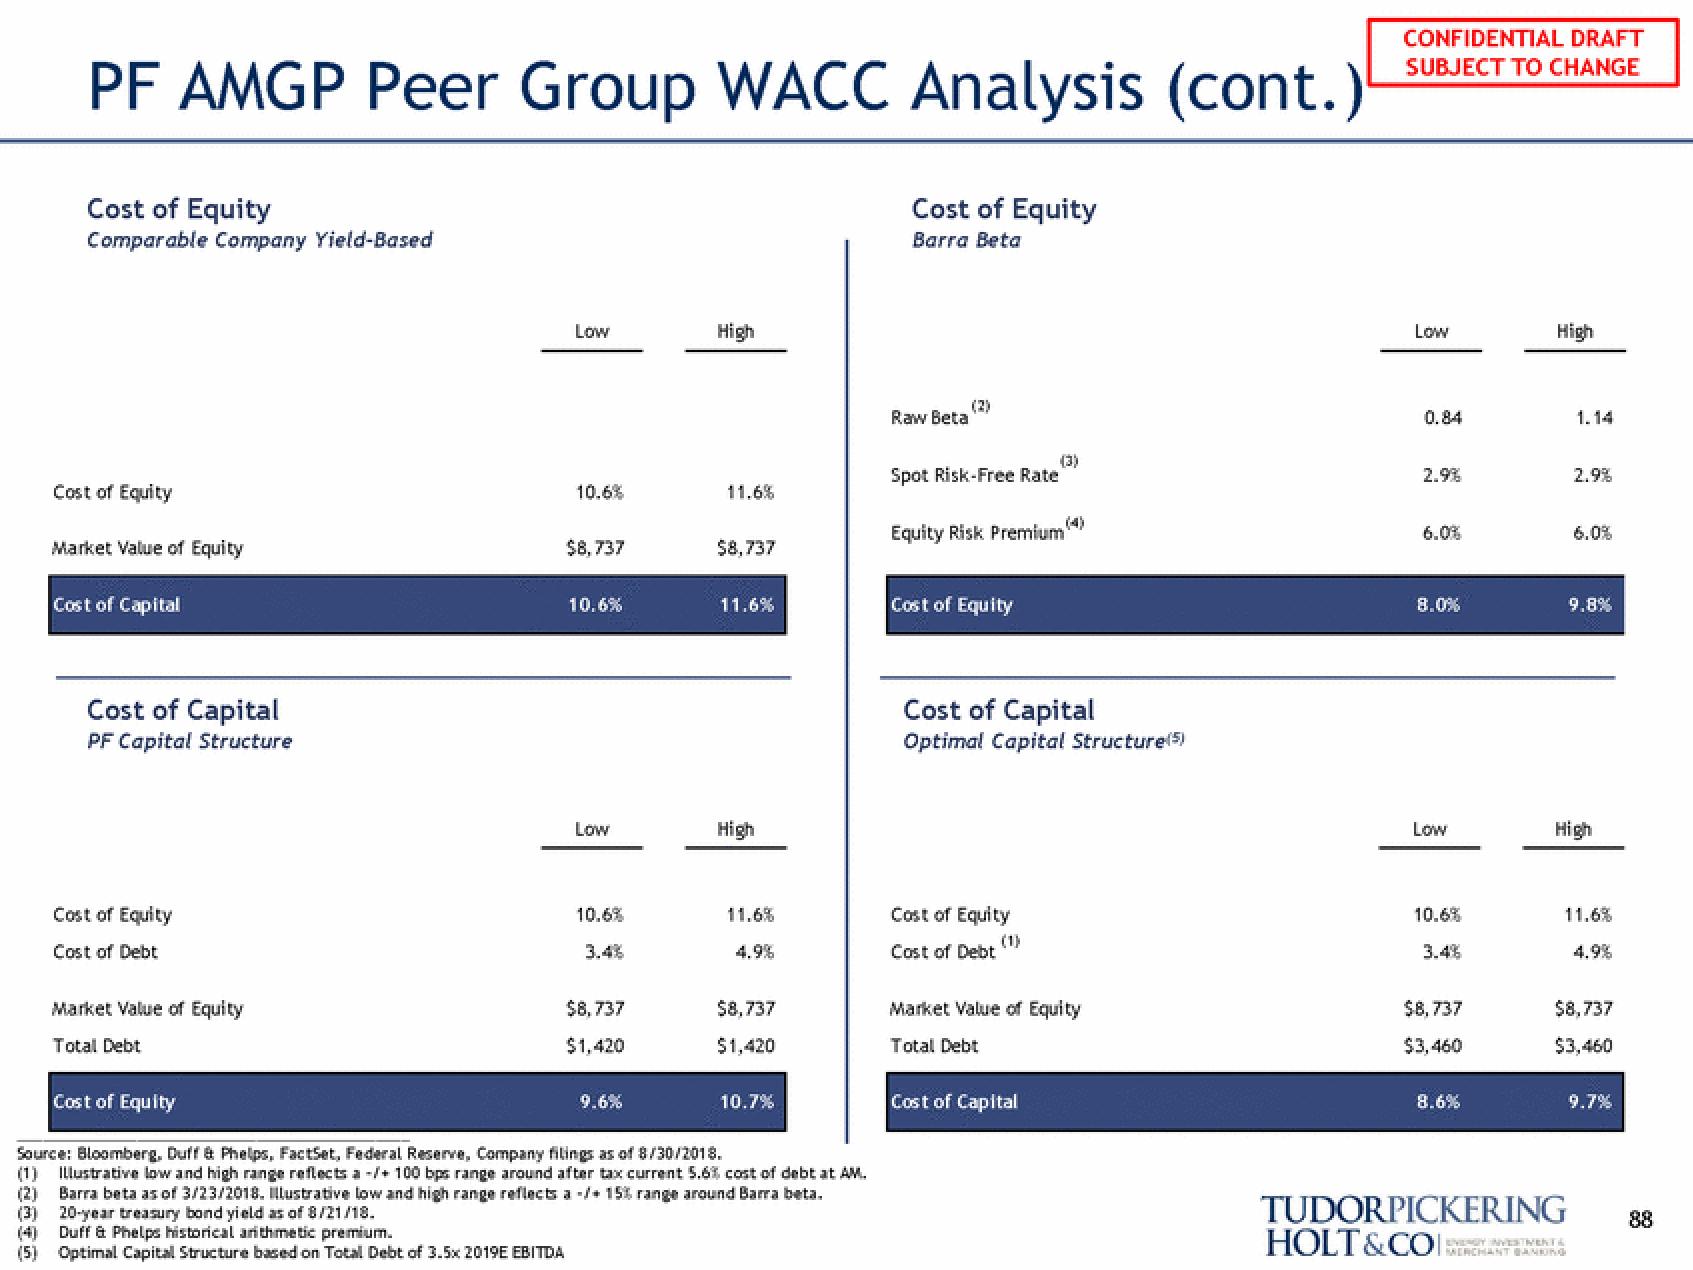
PF AMGP Peer Group WACC Analysis (cont.)
Cost of Equity
Comparable Company Yield-Based
Cost of Equity
Market Value of Equity
Cost of Capital
Cost of Capital
PF Capital Structure
Cost of Equity
Cost of Debt
Market Value of Equity
Total Debt
Cost of Equity
Low
Duff & Phelps historical arithmetic premium.
(5) Optimal Capital Structure based on Total Debt of 3.5x 2019E EBITDA
10.6%
$8,737
10.6%
Low
10.6%
3.4%
$8,737
$1,420
9.6%
High
11.6%
$8,737
11.6%
High
11.6%
4.9%
$8,737
$1,420
10.7%
Source: Bloomberg, Duff & Phelps, FactSet, Federal Reserve, Company filings as of 8/30/2018.
(1) Illustrative low and high range reflects a -/+ 100 bps range around after tax current 5.6% cost of debt at AM.
(2) Barra beta as of 3/23/2018. Illustrative low and high range reflects a -/+ 15% range around Barra beta.
(3) 20-year treasury bond yield as of 8/21/18.
Cost of Equity
Barra Beta
Raw Beta
(2)
Spot Risk-Free Rate
Equity Risk Premium
Cost of Equity
(3)
Cost of Capital
Optimal Capital Structure (5)
Cost of Equity
Cost of Debt
Market Value of Equity
Total Debt
Cost of Capital
CONFIDENTIAL DRAFT
SUBJECT TO CHANGE
Low
0.84
2.9%
6.0%
8.0%
Low
10.6%
$8,737
$3,460
8.6%
High
1.14
2.9%
6.0%
9.8%
High
11.6%
4.9%
$8,737
$3,460
9.7%
TUDORPICKERING 88
HOLT&COCHANT BANKINGView entire presentation