OppFi Results Presentation Deck
Condensed Balance Sheet
9
($ in millions)
Assets
Cash and restricted cash
Finance Receivables at Fair Value
Finance Receivables at Amortized
Cost, Net
Other Assets
Total Assets
Liabilities and Stockholders' Equity
Other Liabilities
Total Debt
Warrant Liabilities
Total Liabilities
Total Equity
Total Liabilities and Equity
UNAUDITED PERIOD ENDED
12/31/2021
$62.4
383.9
4.2
51.6
$502.1
$59.0
274.0
11.2
344.2
157.9
$502.1
6/30/2022
$57.6
450.7
4.6
65.2
$578.1
$70.5
336.5
5.5
412.6
165.5
$578.1
Key Highlights
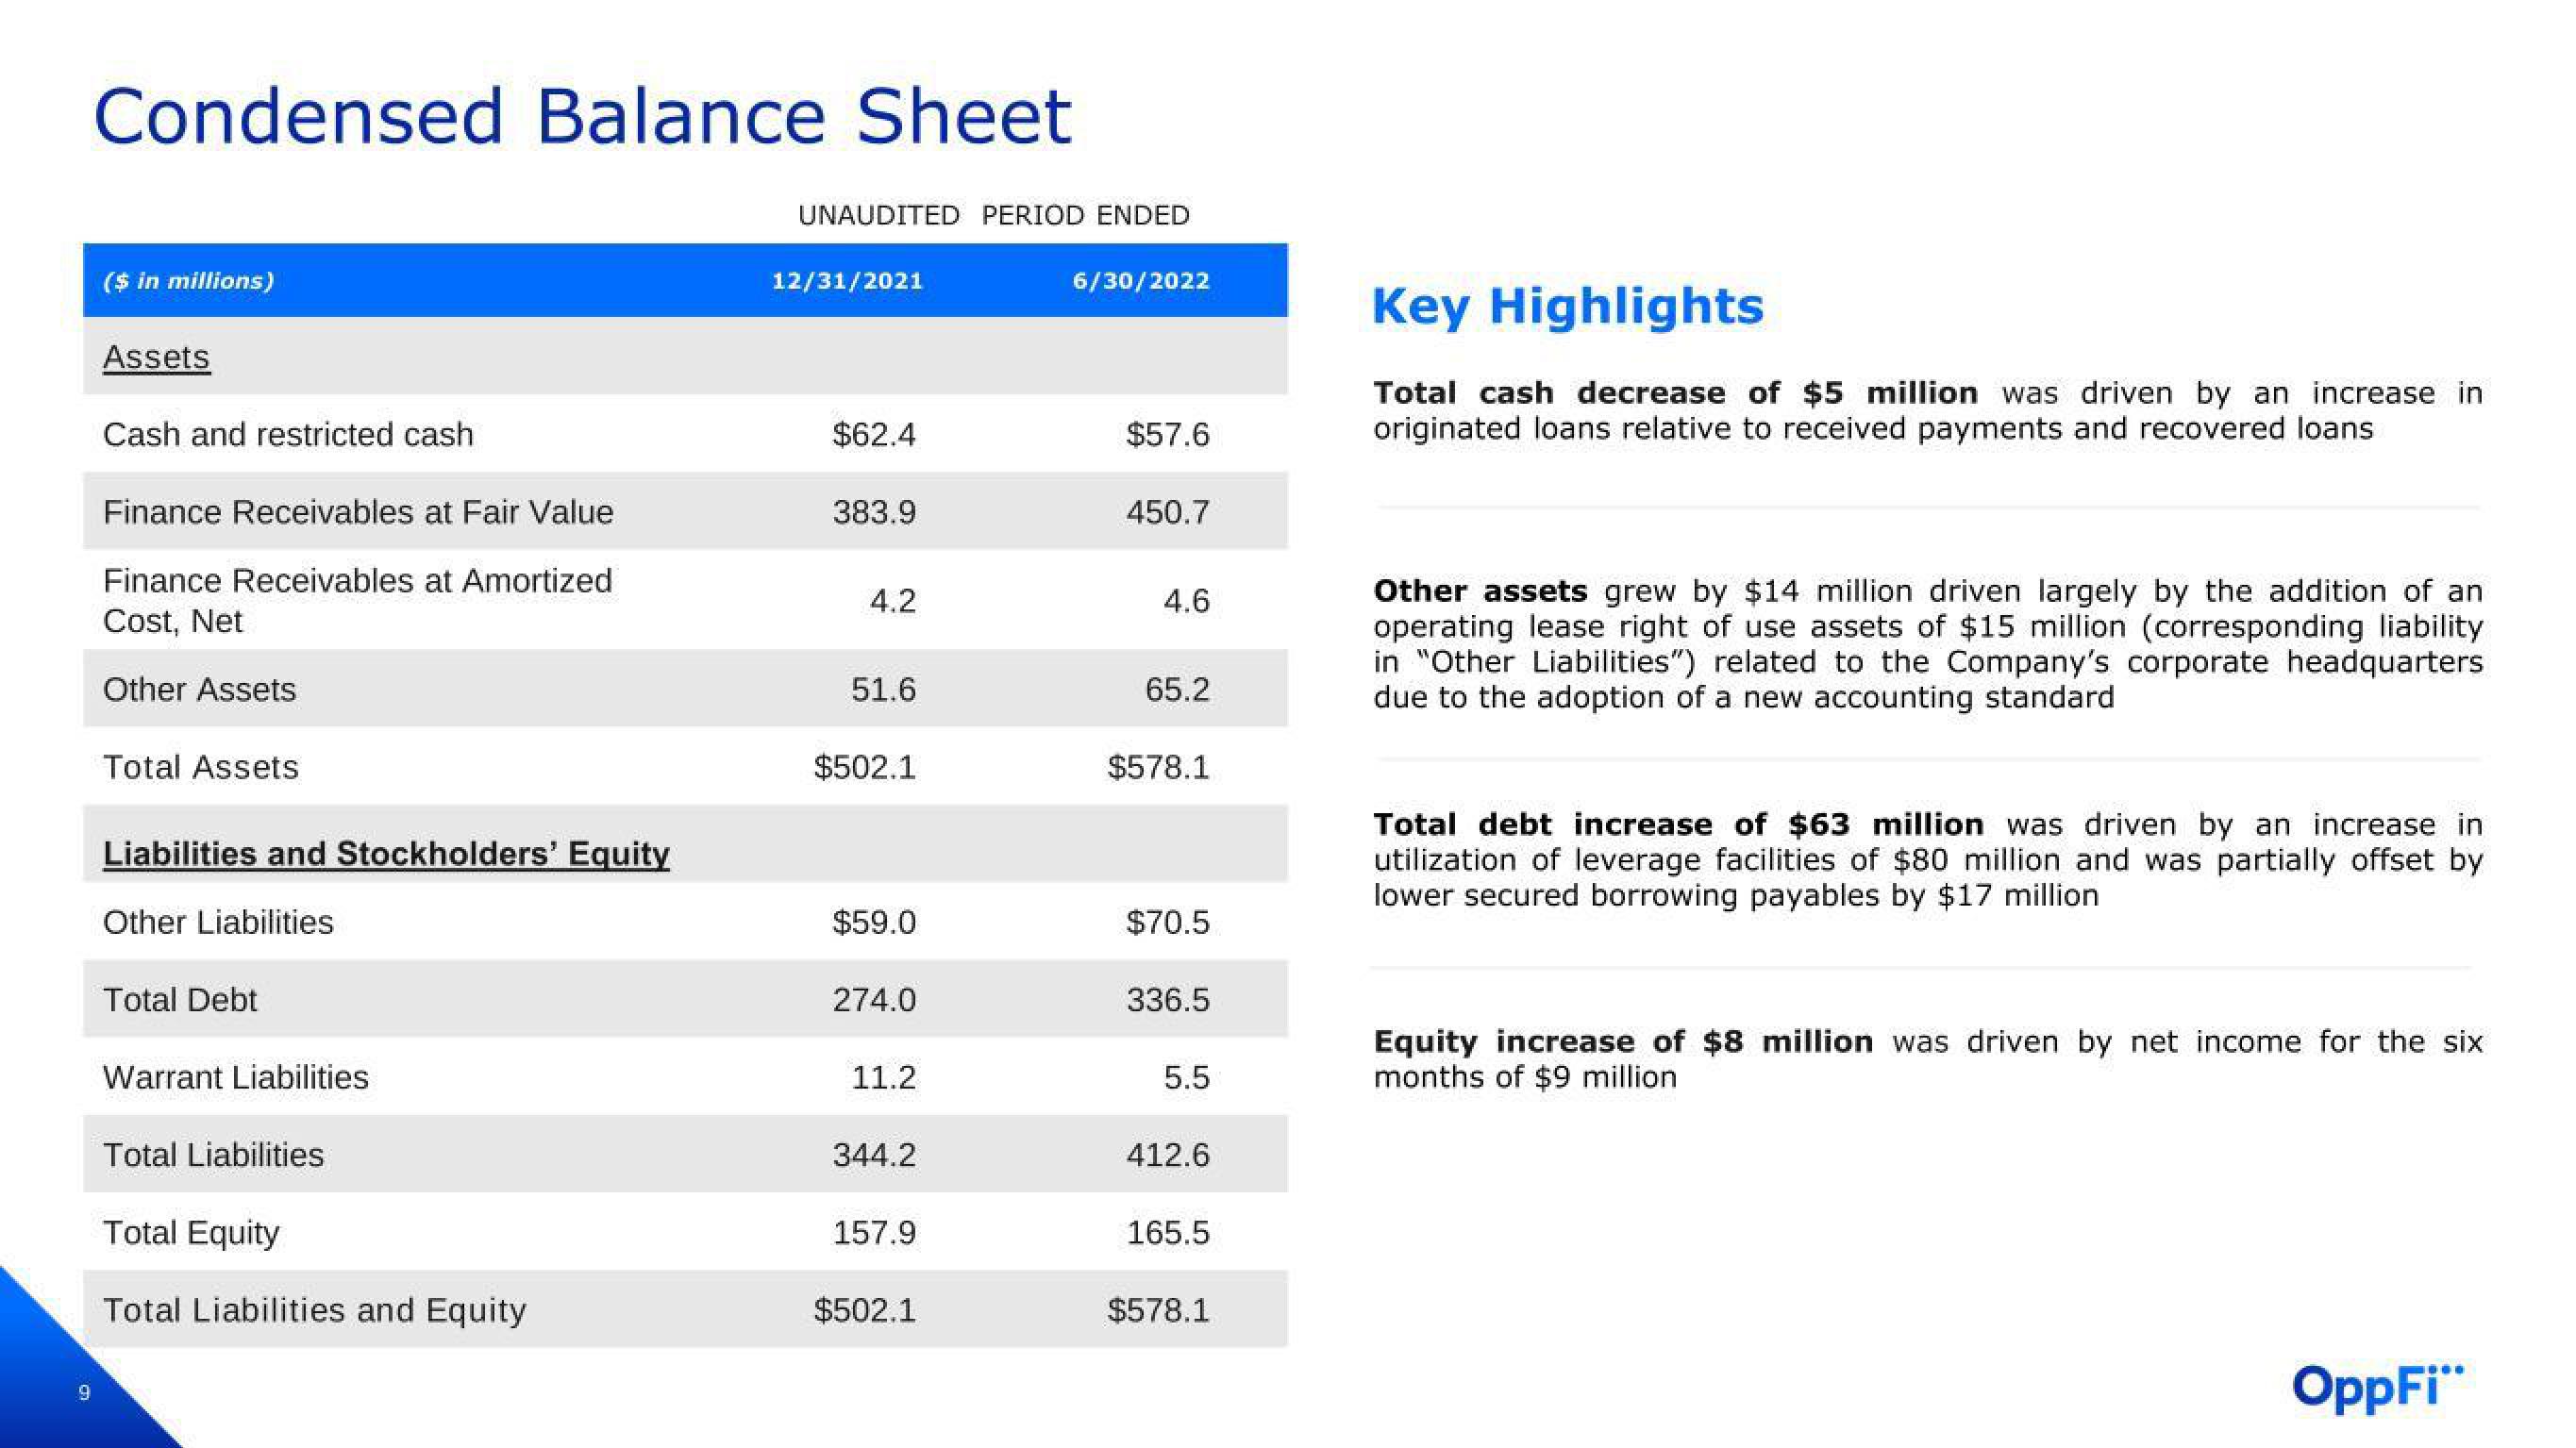
Total cash decrease of $5 million was driven by an increase in
originated loans relative to received payments and recovered loans
Other assets grew by $14 million driven largely by the addition of an
operating lease right of use assets of $15 million (corresponding liability
in "Other Liabilities") related to the Company's corporate headquarters
due to the adoption of a new accounting standard
Total debt increase of $63 million was driven by an increase in
utilization of leverage facilities of $80 million and was partially offset by
lower secured borrowing payables by $17 million
Equity increase of $8 million was driven by net income for the six
months of $9 million
OppFi"View entire presentation