Marten Transport Results Presentation Deck
PL
$300
$275
$250
$225
$200
$175
$150
$125
$100
$75
$50
$25
$0
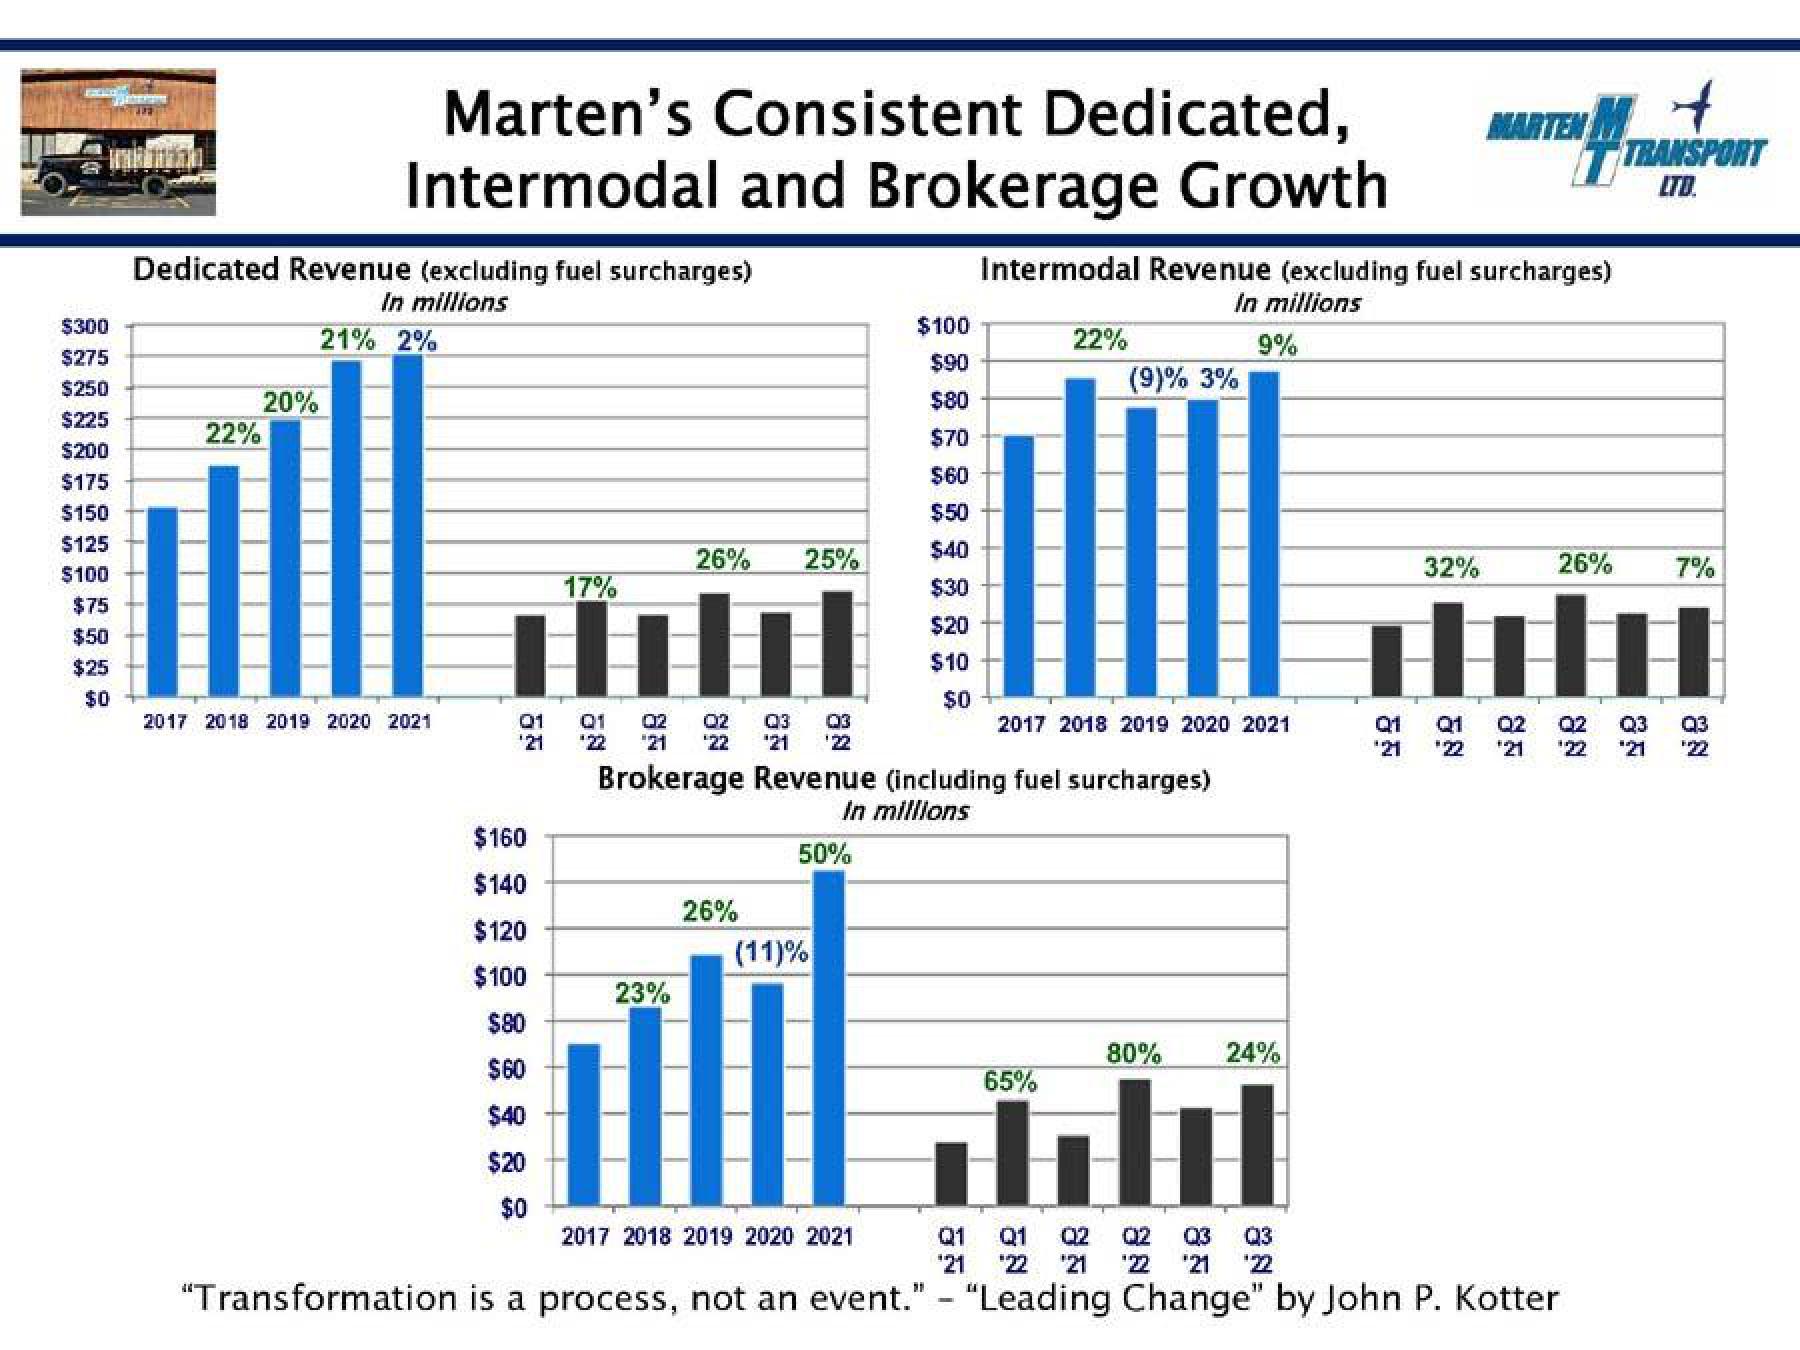
Dedicated Revenue (excluding fuel surcharges)
In millions
22%
Marten's Consistent Dedicated,
Intermodal and Brokerage Growth
20%
21% 2%
2017 2018 2019 2020 2021
01
¹21
$160
$140
$120
$100
17%
ull
01 02 02 Q3 03
'22 "21 $22 '21 '22
$80
$60
$40
$20
$0
26%
23%
25%
26%
50%
(11)%
$100
$90
$80
$70
$60
$50
$40
$30
$20
$10
$0
Brokerage Revenue (including fuel surcharges)
In millions
2017 2018 2019 2020 2021
Intermodal Revenue (excluding fuel surcharges)
in millions
9%
22%
(9)% 3%
2017 2018 2019 2020 2021
65%
MARTEN M
32%
24%
26%
80%
HI
Q1 Q1 02
¹21 '22 '21
Q2 Q3 Q3
'22
'21 '22
"Transformation is a process, not an event." - "Leading Change" by John P. Kotter
TRANSPORT
LTD.
7%
Hull
01
Q1 02
¹21 *22 ¹21
Q2 Q3 Q3
¹22 21 ¹22View entire presentation