Main Street Capital Investor Presentation Deck
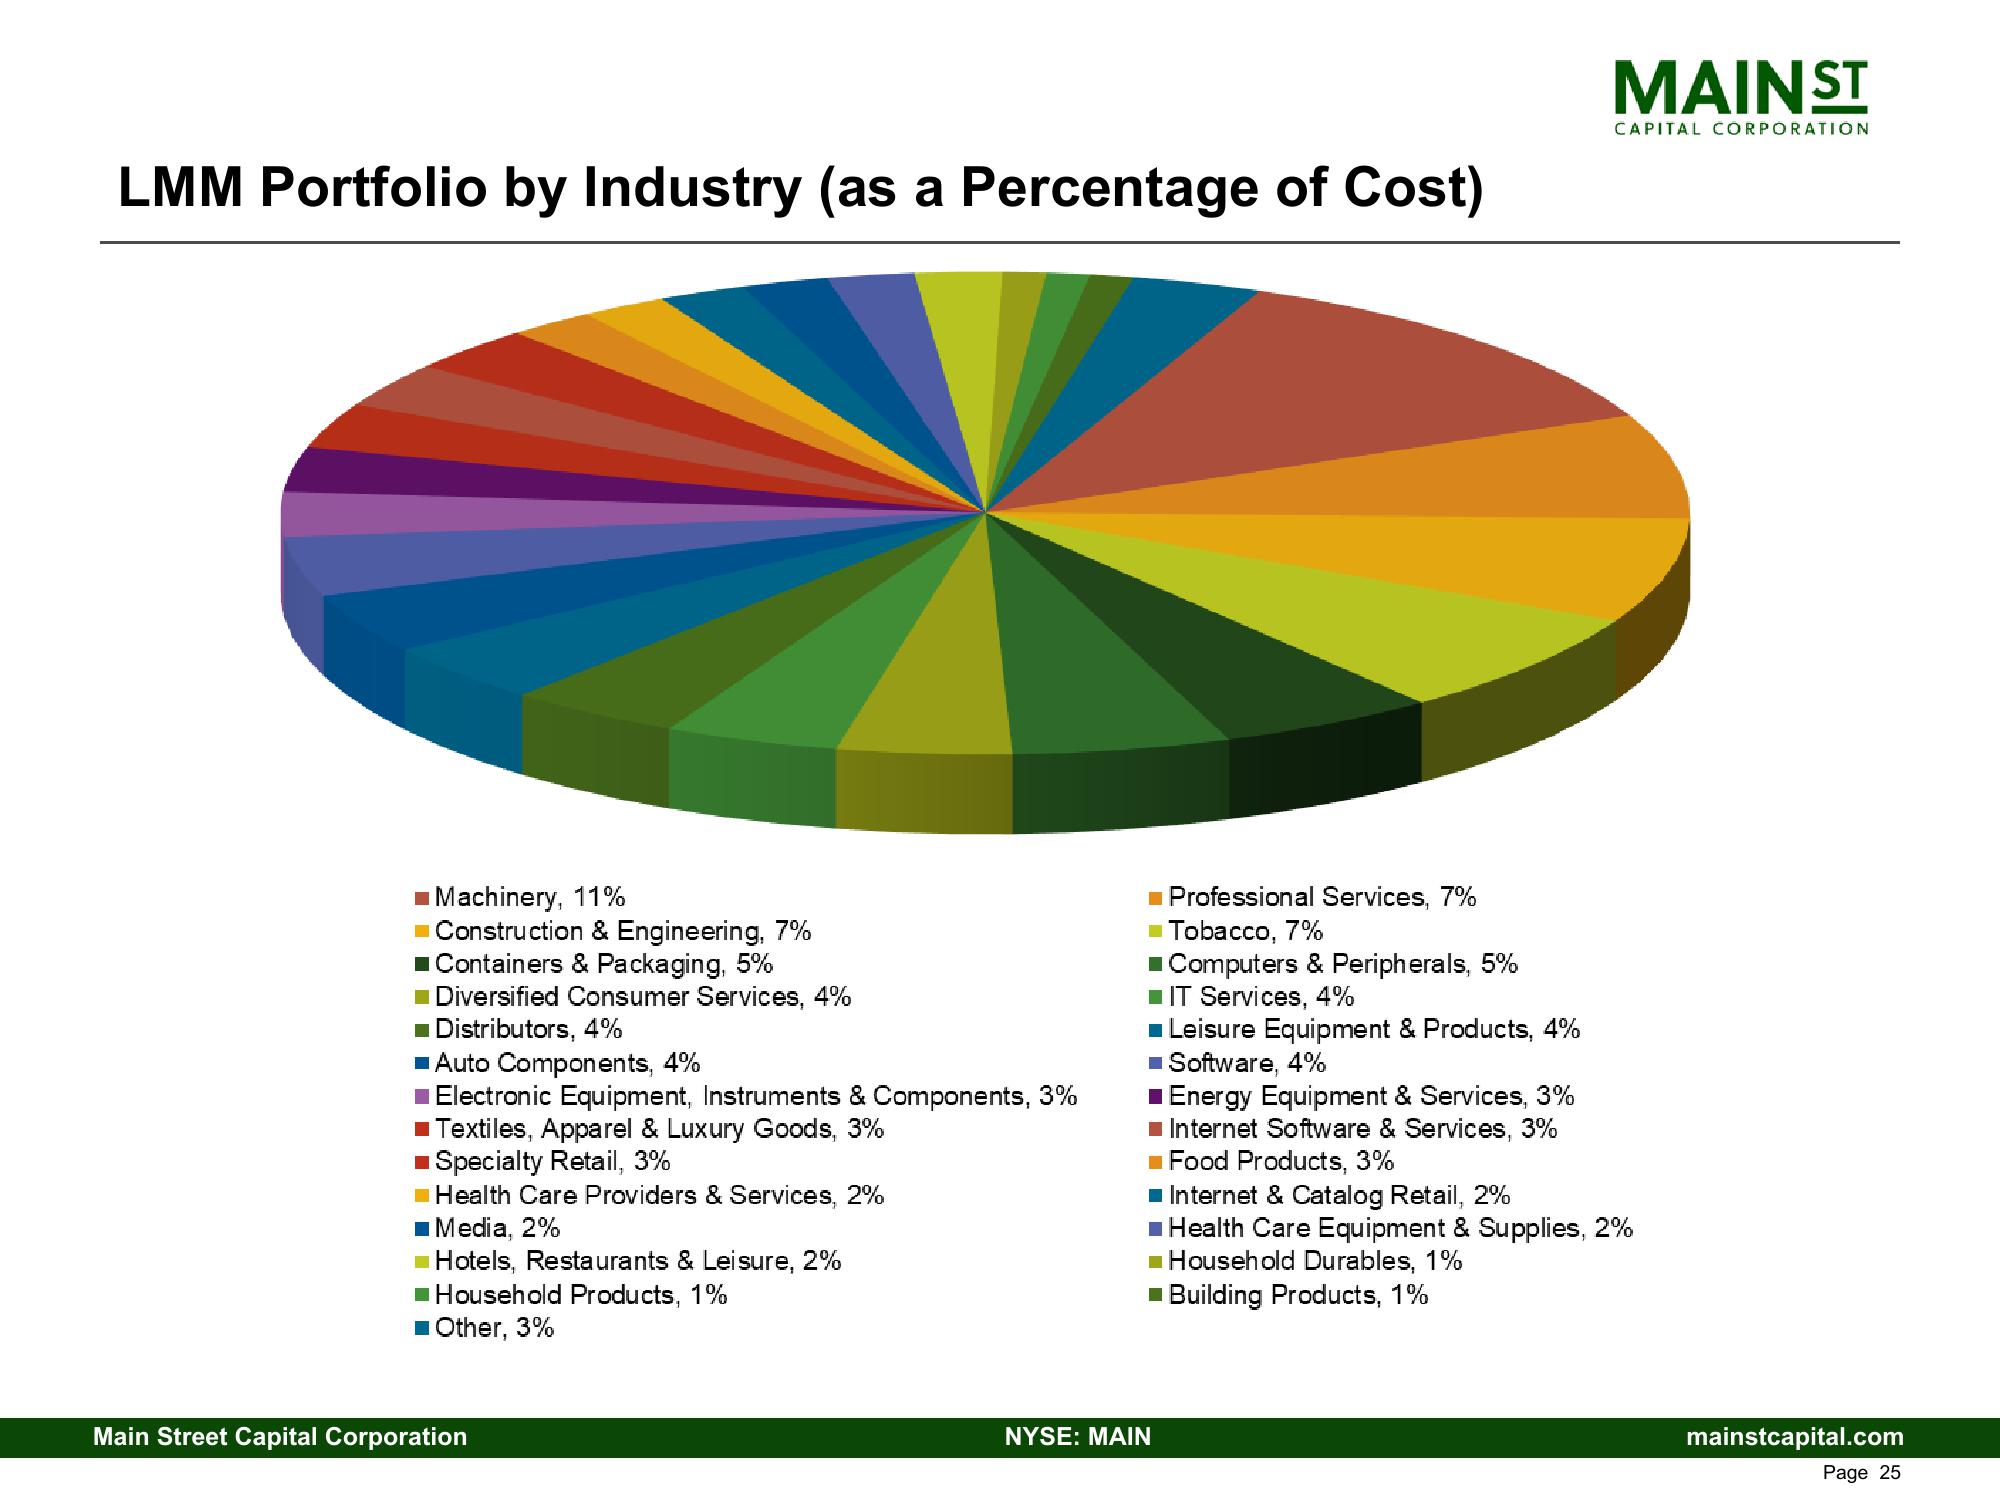
LMM Portfolio by Industry (as a Percentage of Cost)
■Machinery, 11%
Construction & Engineering, 7%
■Containers & Packaging, 5%
Diversified Consumer Services, 4%
■ Distributors, 4%
■Auto Components, 4%
Electronic Equipment, Instruments & Components, 3%
Textiles, Apparel & Luxury Goods, 3%
■Specialty Retail, 3%
■Health Care Providers & Services, 2%
■ Media, 2%
Hotels, Restaurants & Leisure, 2%
■Household Products, 1%
■ Other, 3%
Main Street Capital Corporation
■ Professional Services, 7%
■ Tobacco, 7%
■ Computers & Peripherals, 5%
■IT Services, 4%
■ Leisure Equipment & Products, 4%
■ Software, 4%
■Household Durables, 1%
■ Building Products, 1%
MAIN ST
■ Energy Equipment & Services, 3%
■Internet Software & Services, 3%
■Food Products, 3%
■ Internet & Catalog Retail, 2%
■Health Care Equipment & Supplies, 2%
NYSE: MAIN
CAPITAL CORPORATION
mainstcapital.com
Page 25View entire presentation