Comcast Results Presentation Deck
Cable Communications 3rd Quarter 2021 Overview
Customer Relationships (M) Revenue
Per CR*
32.7
Adjusted EBITDA
5
3Q20
$6.4
$65.99
+5.3%
3Q20
+4.2%
34.0
3Q21
+10.3%
$7.1
$69.47
$15.0
3Q21
3Q20
($B) Net Cash Flow
$4.3
+7.4%
$16.1
3Q21
+15.6%
$5.0
($B)
($B)
Commentary
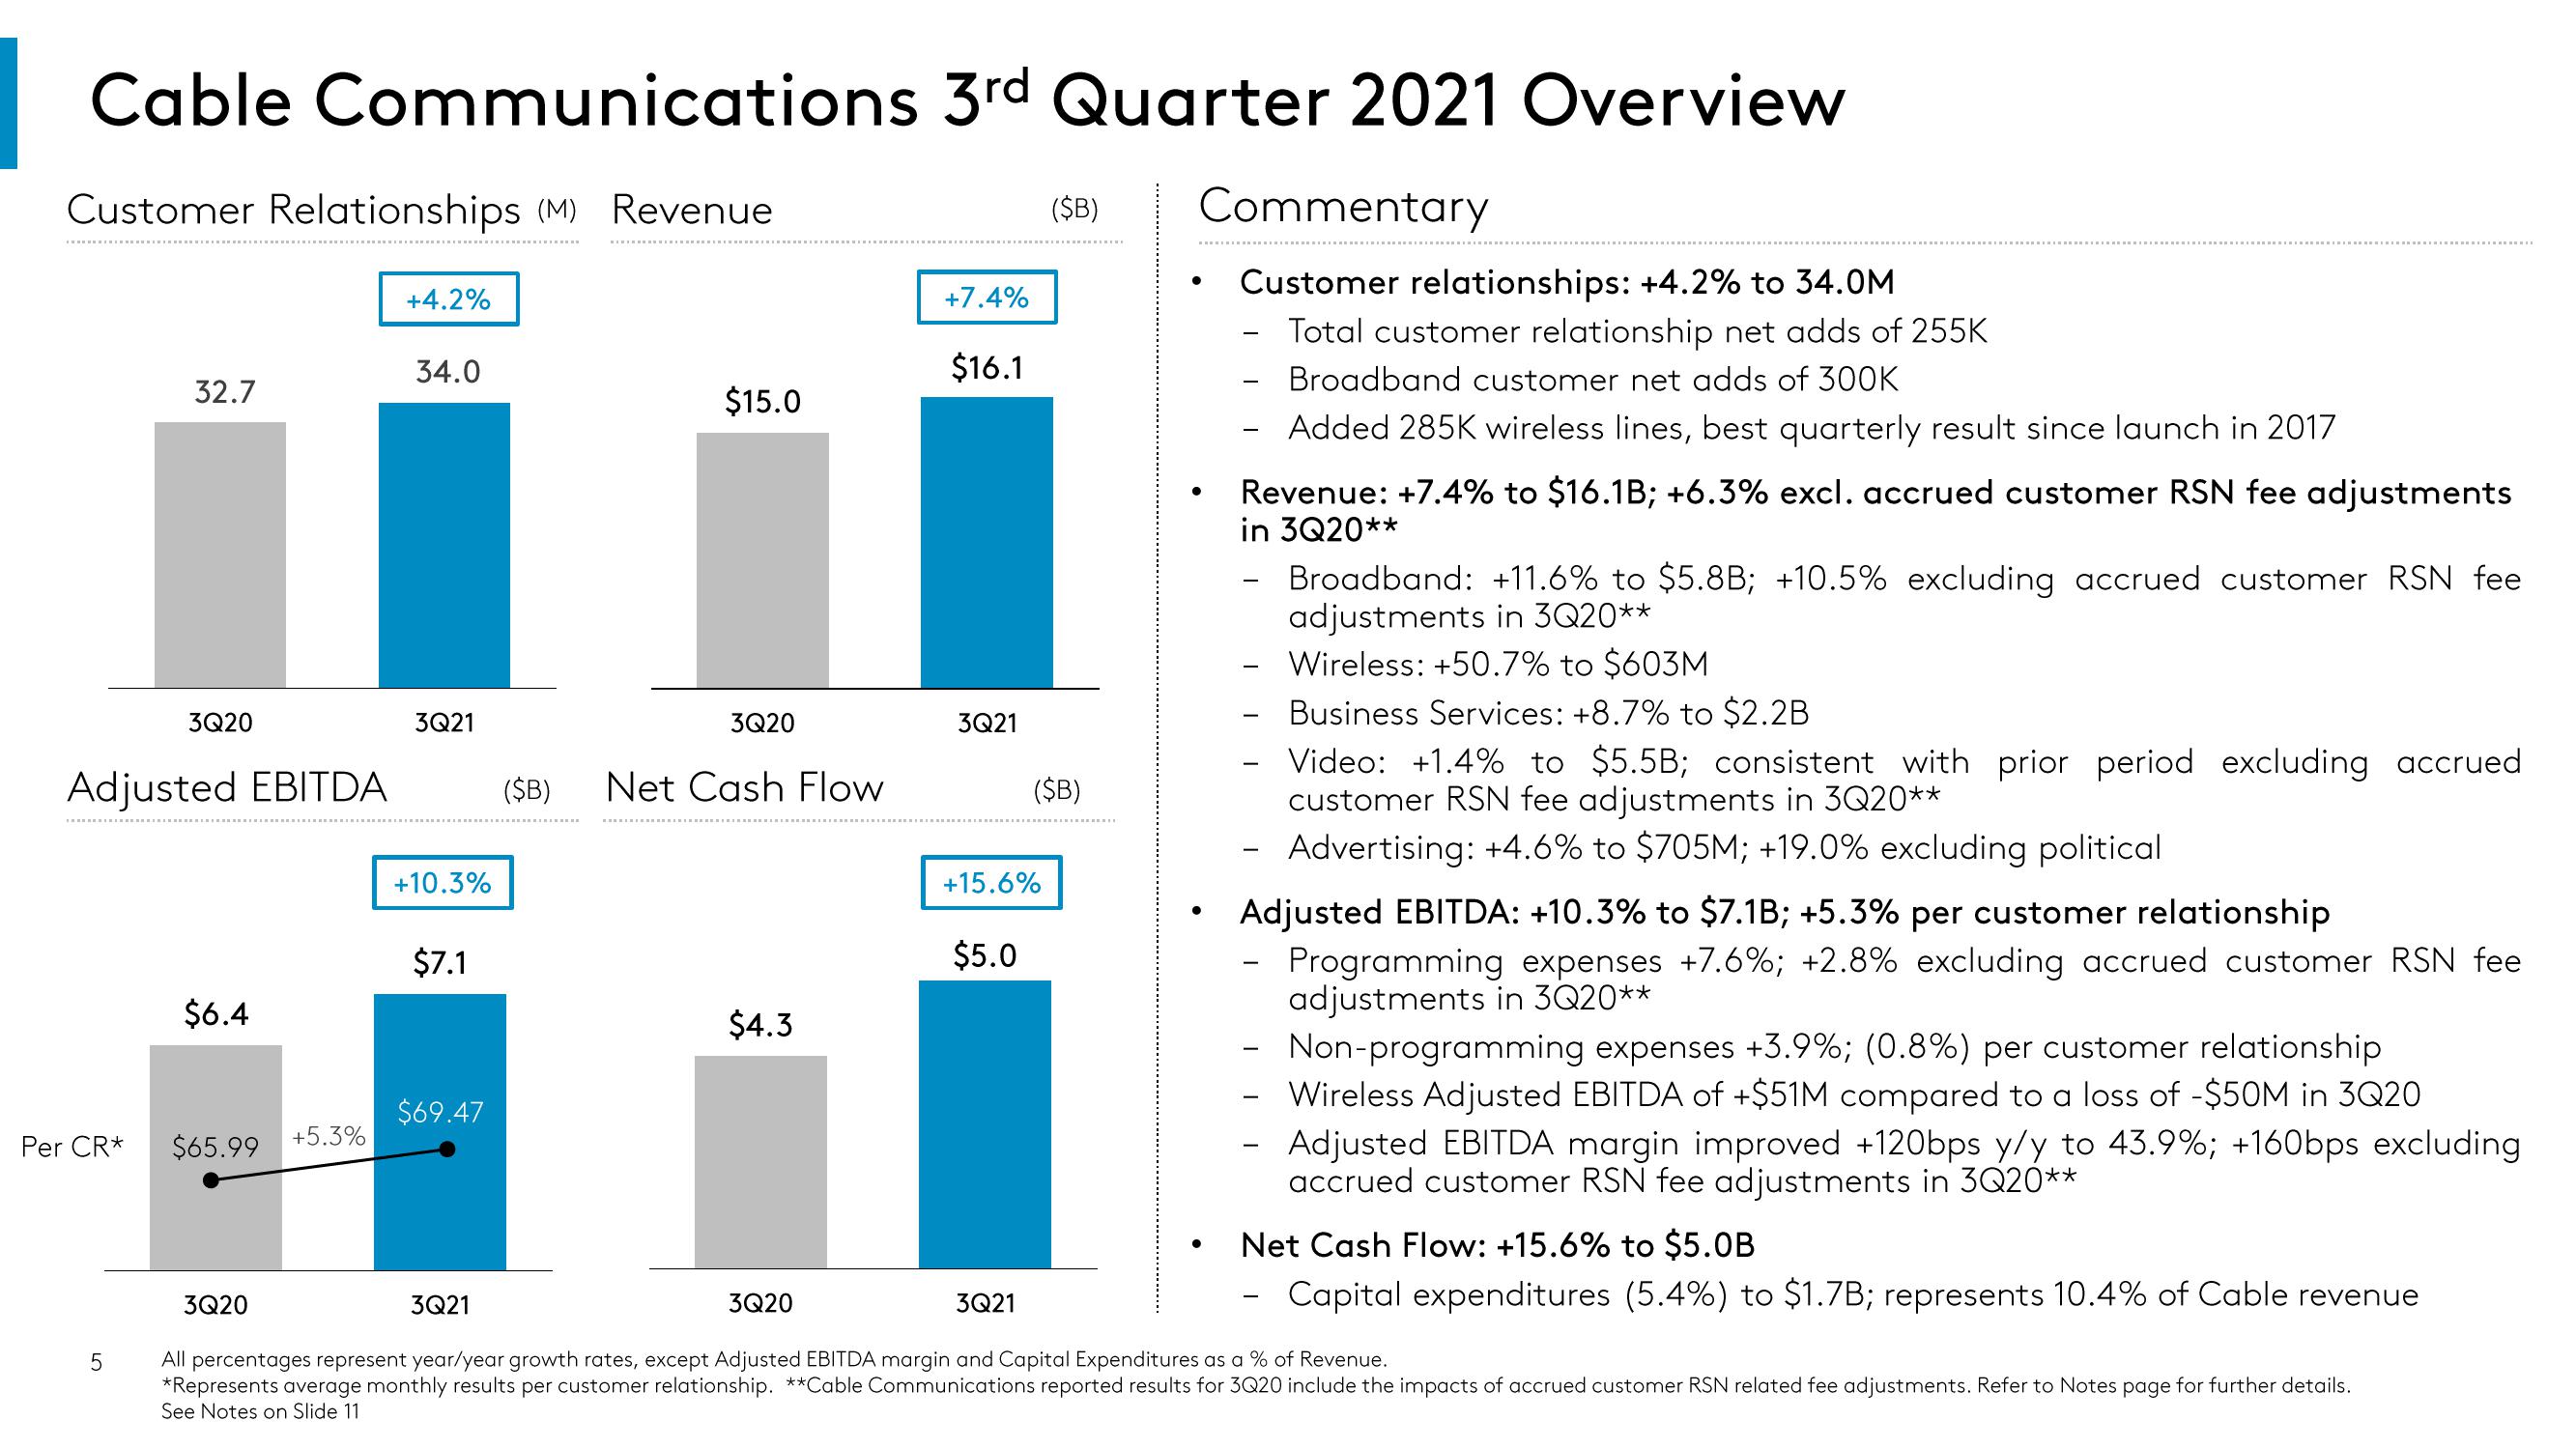
Customer relationships: +4.2% to 34.0M
Total customer relationship net adds of 255K
Broadband customer net adds of 300K
Added 285K wireless lines, best quarterly result since launch in 2017
●
-
Revenue: +7.4% to $16.1B; +6.3% excl. accrued customer RSN fee adjustments
in 3Q20**
-
Broadband: +11.6% to $5.8B; +10.5% excluding accrued customer RSN fee
adjustments in 3Q20**
Wireless: +50.7% to $603M
Business Services: +8.7% to $2.2B
Video: +1.4% to $5.5B; consistent with prior period excluding accrued
customer RSN fee adjustments in 3Q20**
Advertising: +4.6% to $705M; +19.0% excluding political
Adjusted EBITDA: +10.3% to $7.1B; +5.3% per customer relationship
Programming expenses +7.6%; +2.8% excluding accrued customer RSN fee
adjustments in 3Q20**
-
Non-programming expenses +3.9%; (0.8%) per customer relationship
Wireless Adjusted EBITDA of +$51M compared to a loss of -$50M in 3Q20
Adjusted EBITDA margin improved +120bps y/y to 43.9%; +160bps excluding
accrued customer RSN fee adjustments in 3Q20**
3Q20
3Q21
All percentages represent year/year growth rates, except Adjusted EBITDA margin and Capital Expenditures as a % of Revenue.
*Represents average monthly results per customer relationship. **Cable Communications reported results for 3Q20 include the impacts of accrued customer RSN related fee adjustments. Refer to Notes page for further details.
See Notes on Slide 11
Net Cash Flow: +15.6% to $5.OB
Capital expenditures (5.4%) to $1.7B; represents 10.4% of Cable revenueView entire presentation