Dynatrace Results Presentation Deck
1)
2)
3)
4)
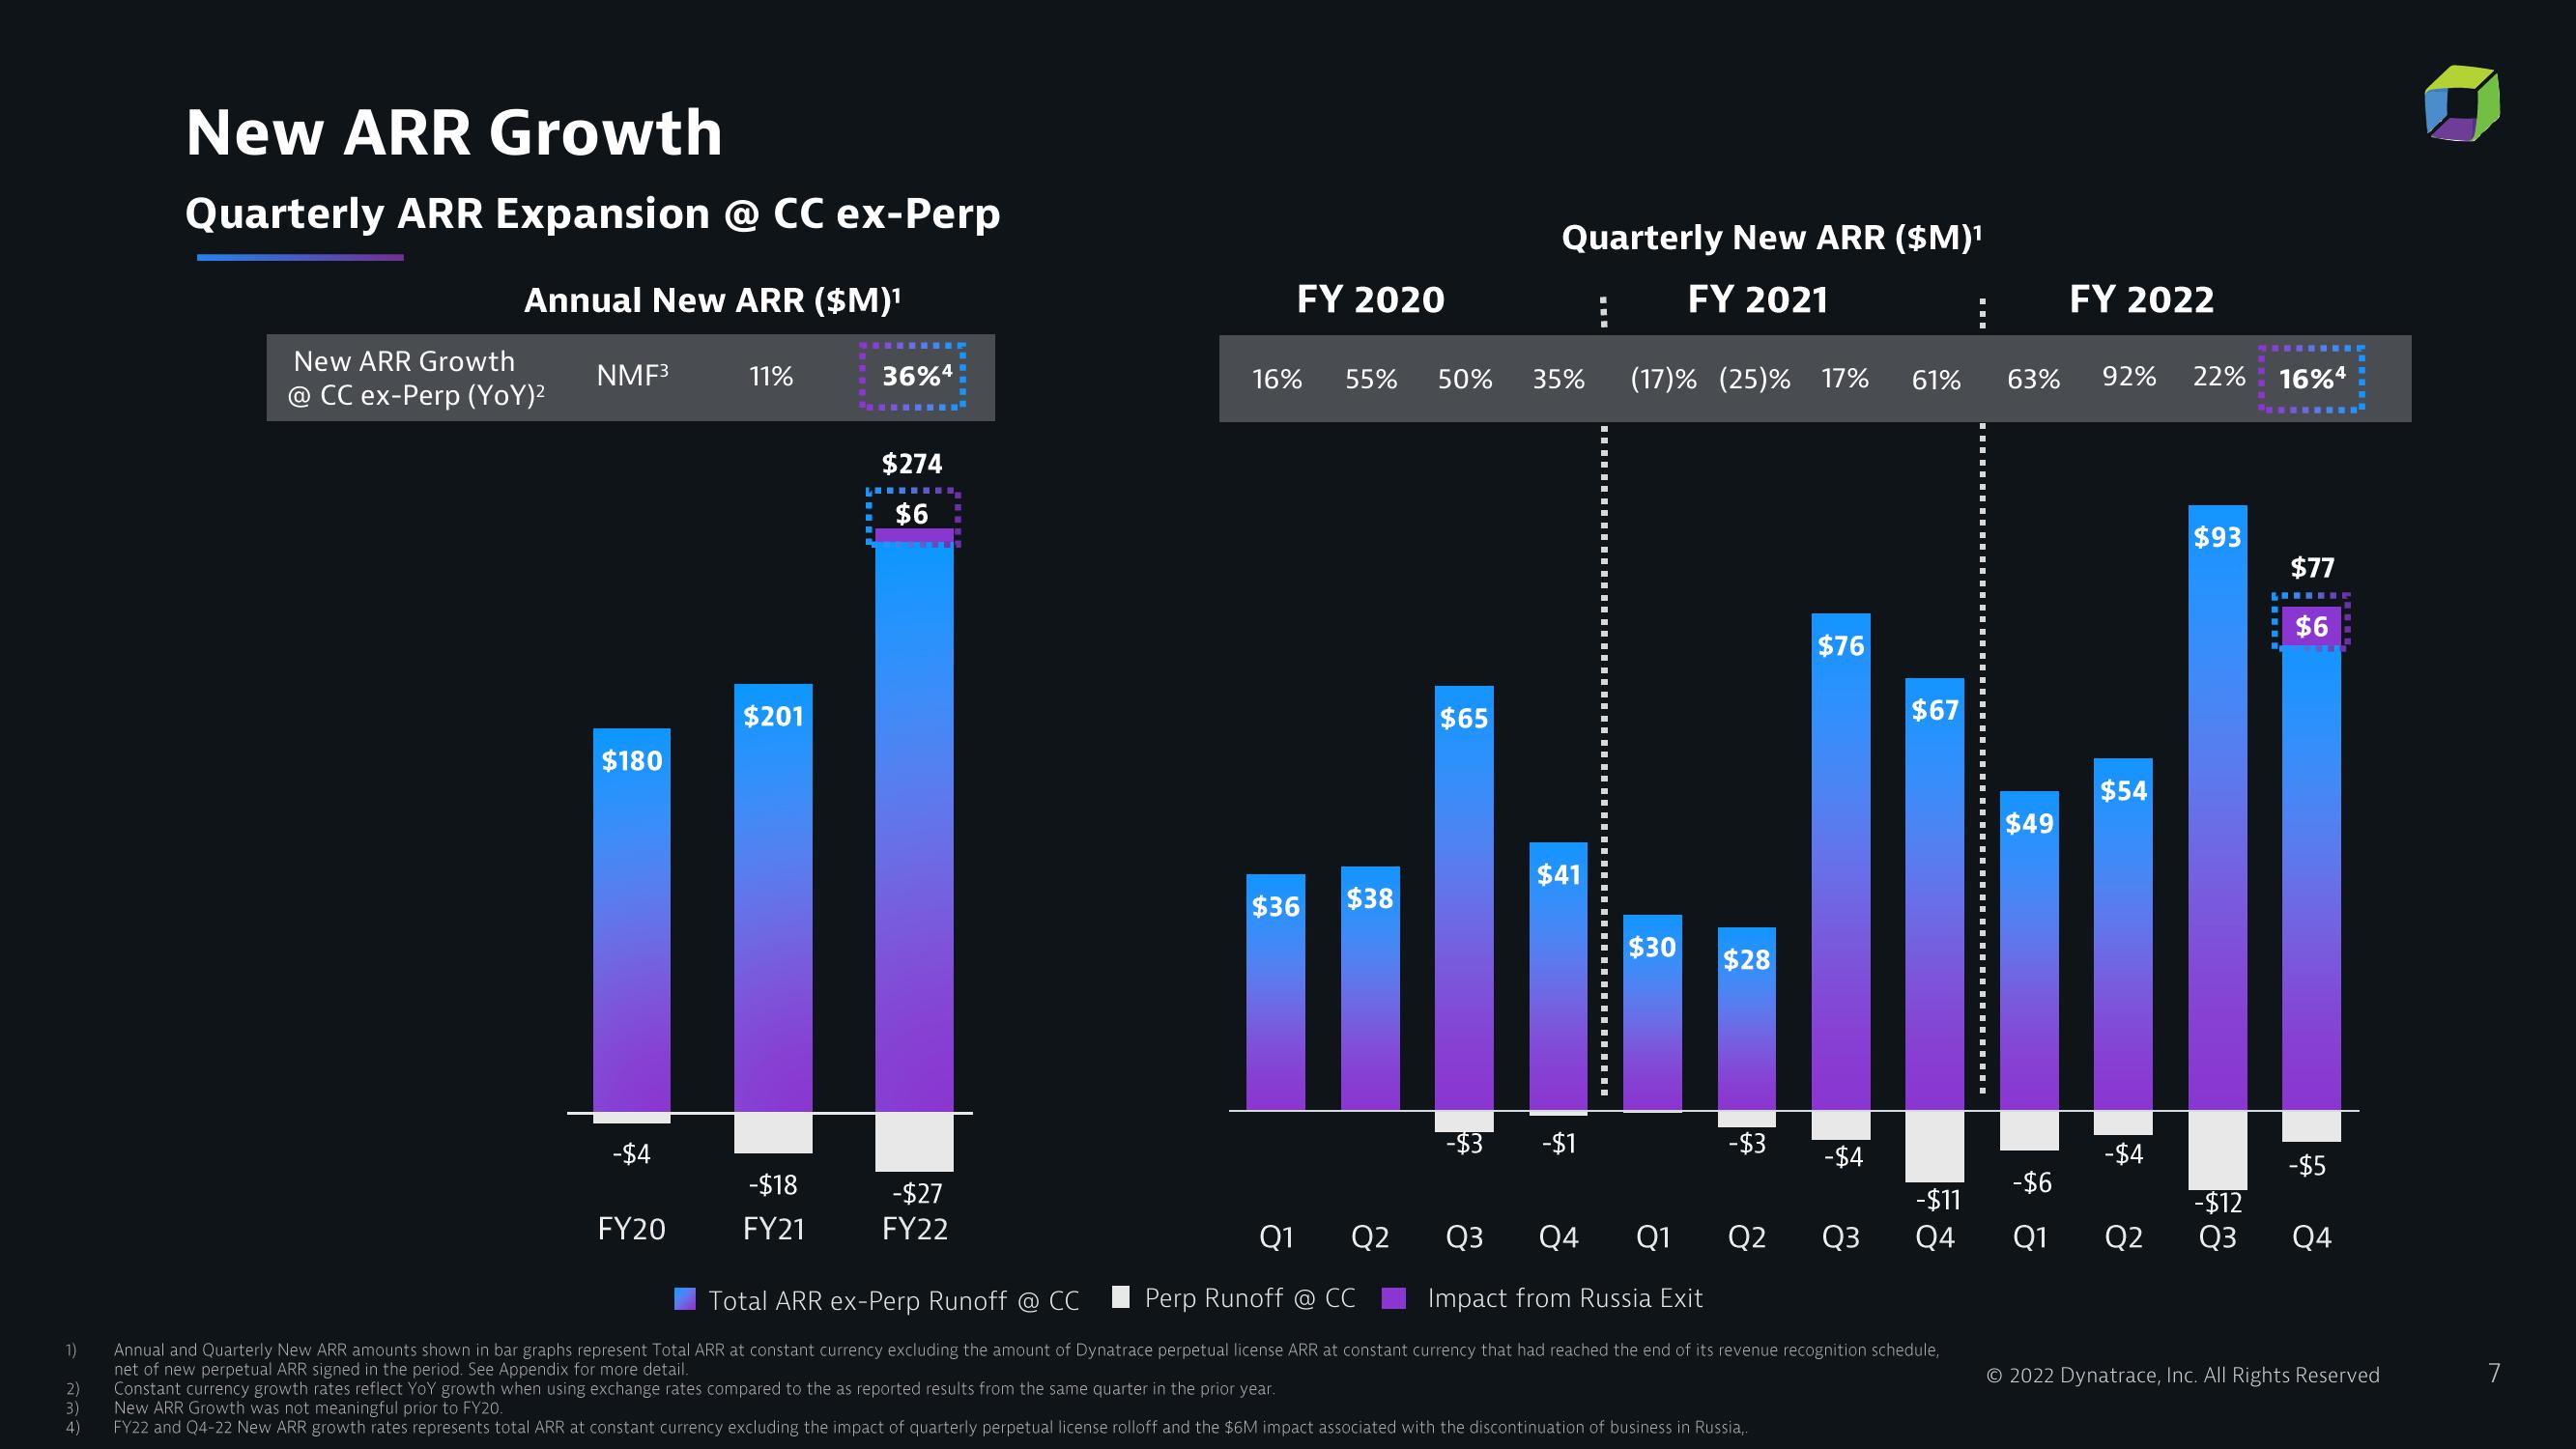
New ARR Growth
Quarterly ARR Expansion @ CC ex-Perp
Annual New ARR ($M)¹
New ARR Growth
@CC ex-Perp (YoY)²
NMF³
$180
11%
FY20
$201
11
-$4
-$18
FY21
36%4
$274
➖➖➖➖
$6
-$27
FY22
FY 2020
16%
55%
$36 $38
Q1 Q2
50%
$65
Quarterly New ARR ($M)¹
FY 2021
(17) % (25) % 17%
35%
$41
-$1
-$11
Q4 Q1 Q2 Q3 Q4
⠀
61% 63% 92% 22%
$76
$67
$54
$49
Juli
$30
$28
- $3
-$4
-$4
-$6
Q3
Total ARR ex-Perp Runoff @ CC
Perp Runoff @ CC
Impact from Russia Exit
Annual and Quarterly New ARR amounts shown in bar graphs represent Total ARR at constant currency excluding the amount of Dynatrace perpetual license ARR at constant currency that had reached the end of its revenue recognition schedule,
net of new perpetual ARR signed in the period. See Appendix for more detail.
Constant currency growth rates reflect YoY growth when using exchange rates compared to the as reported results from the same quarter in the prior year.
New ARR Growth was not meaningful prior to FY20.
FY22 and Q4-22 New ARR growth rates represents total ARR at constant currency excluding the impact of quarterly perpetual license rolloff and the $6M impact associated with the discontinuation of business in Russia..
FY 2022
$93
16%4
$77
$6
-$5
-$12
Q1 Q2 Q3 Q4
© 2022 Dynatrace, Inc. All Rights Reserved
7View entire presentation