AT&T Results Presentation Deck
4Q21 Financial Summary
$ in billions, except EPS
7
Adjusted EPS
Adj. Ol Margint4
$0.75
$0.78
17.1% 16.2%
4Q20 4Q21
Revenues
Revenues ex Videot5
Video impact
$45.7
$41.0
$39.0 $40.6
4Q20 4Q21
Reported EPS
Adjustments:
Amortization of intangibles
DIRECTV intangible amortization (proportionate share)
Impairments
Actuarial loss/(gain) on benefit plans
Other adjustments
Adjusted EPS
Cash from Ops
Free Cash Flow ²
CAPEX
$10.1
$7.7
4Q20
($1.95)
$0.22
$2.4
4Q20 4Q21
$2.02
$0.43
$0.03
$0.75
$11.3
January 26, 2022 / © 2022 AT&T Intellectual Property - AT&T Proprietary
$8.7
$3.8
$1.3B from DTV
classified as
investing
4Q21
$0.69
$0.12
$0.05
$0.02
($0.12)
$0.02
$0.78
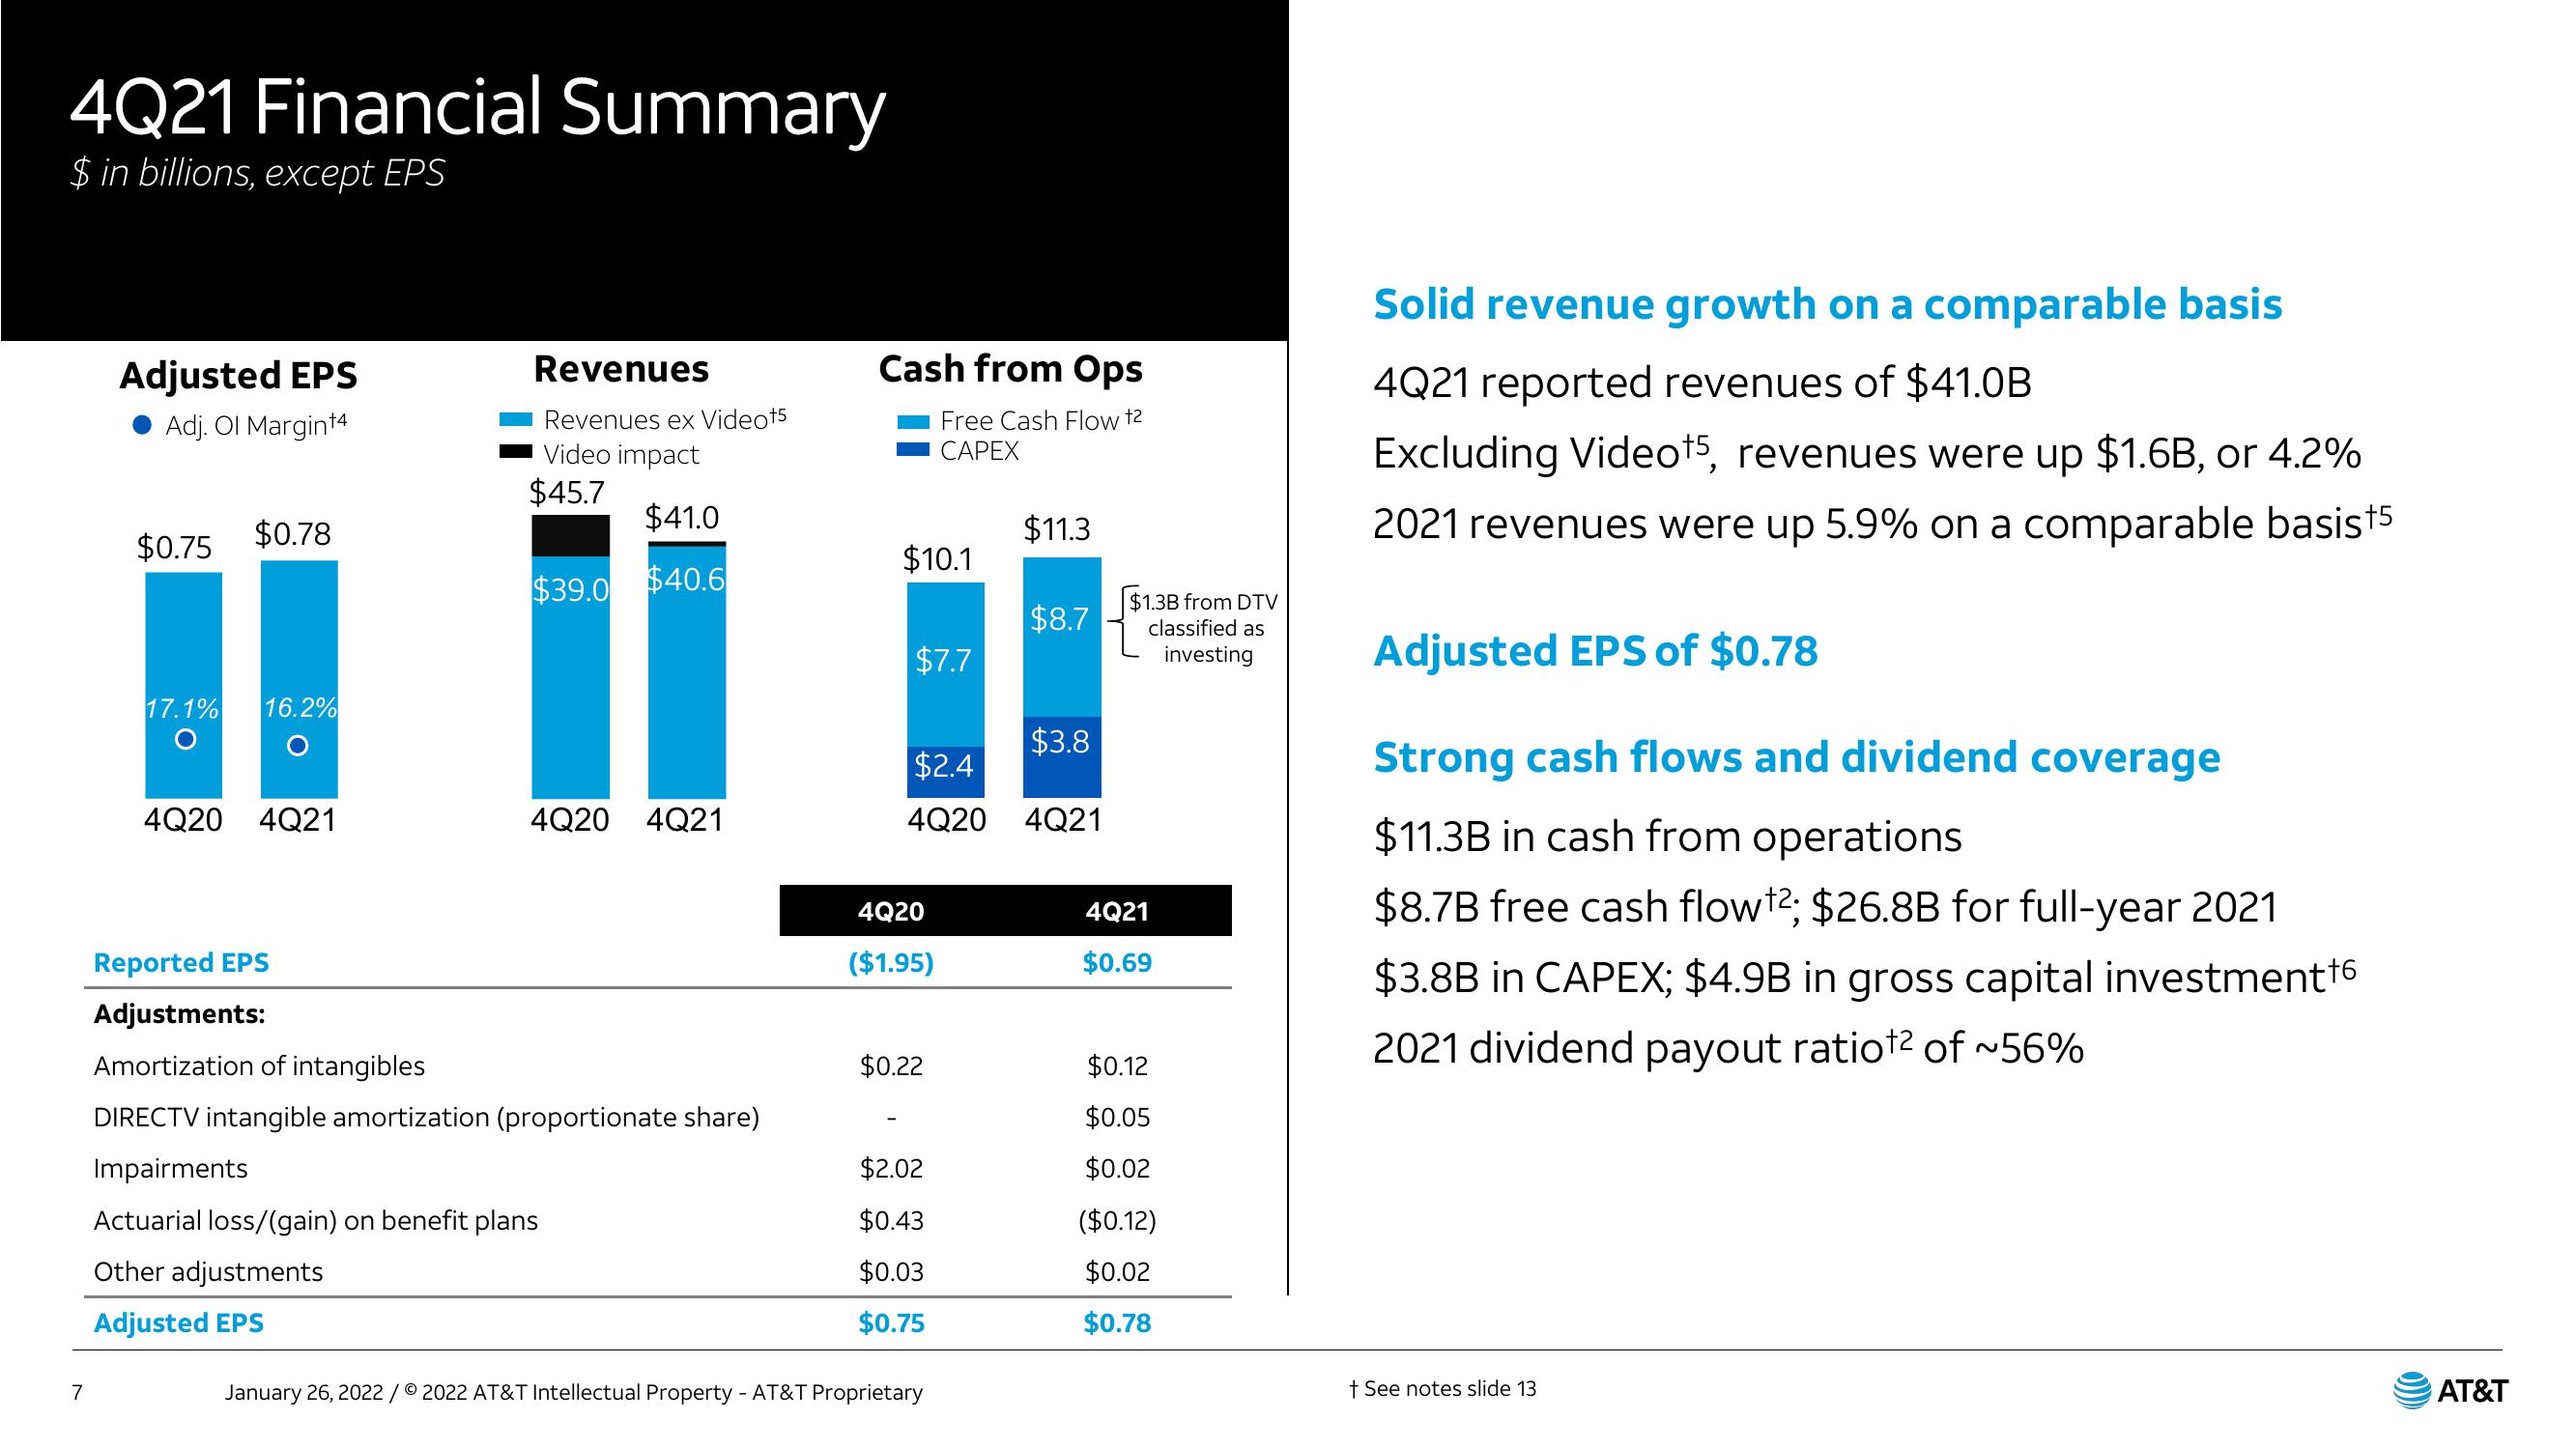
Solid revenue growth on a comparable basis
4Q21 reported revenues of $41.0B
Excluding Videot5, revenues were up $1.6B, or 4.2%
2021 revenues were up 5.9% on a comparable basis†5
Adjusted EPS of $0.78
Strong cash flows and dividend coverage
$11.3B in cash from operations
$8.7B free cash flow t2; $26.8B for full-year 2021
$3.8B in CAPEX; $4.9B in gross capital investment ¹6
2021 dividend payout ratiot2 of ~56%
+ See notes slide 13
AT&TView entire presentation