IGI SPAC Presentation Deck
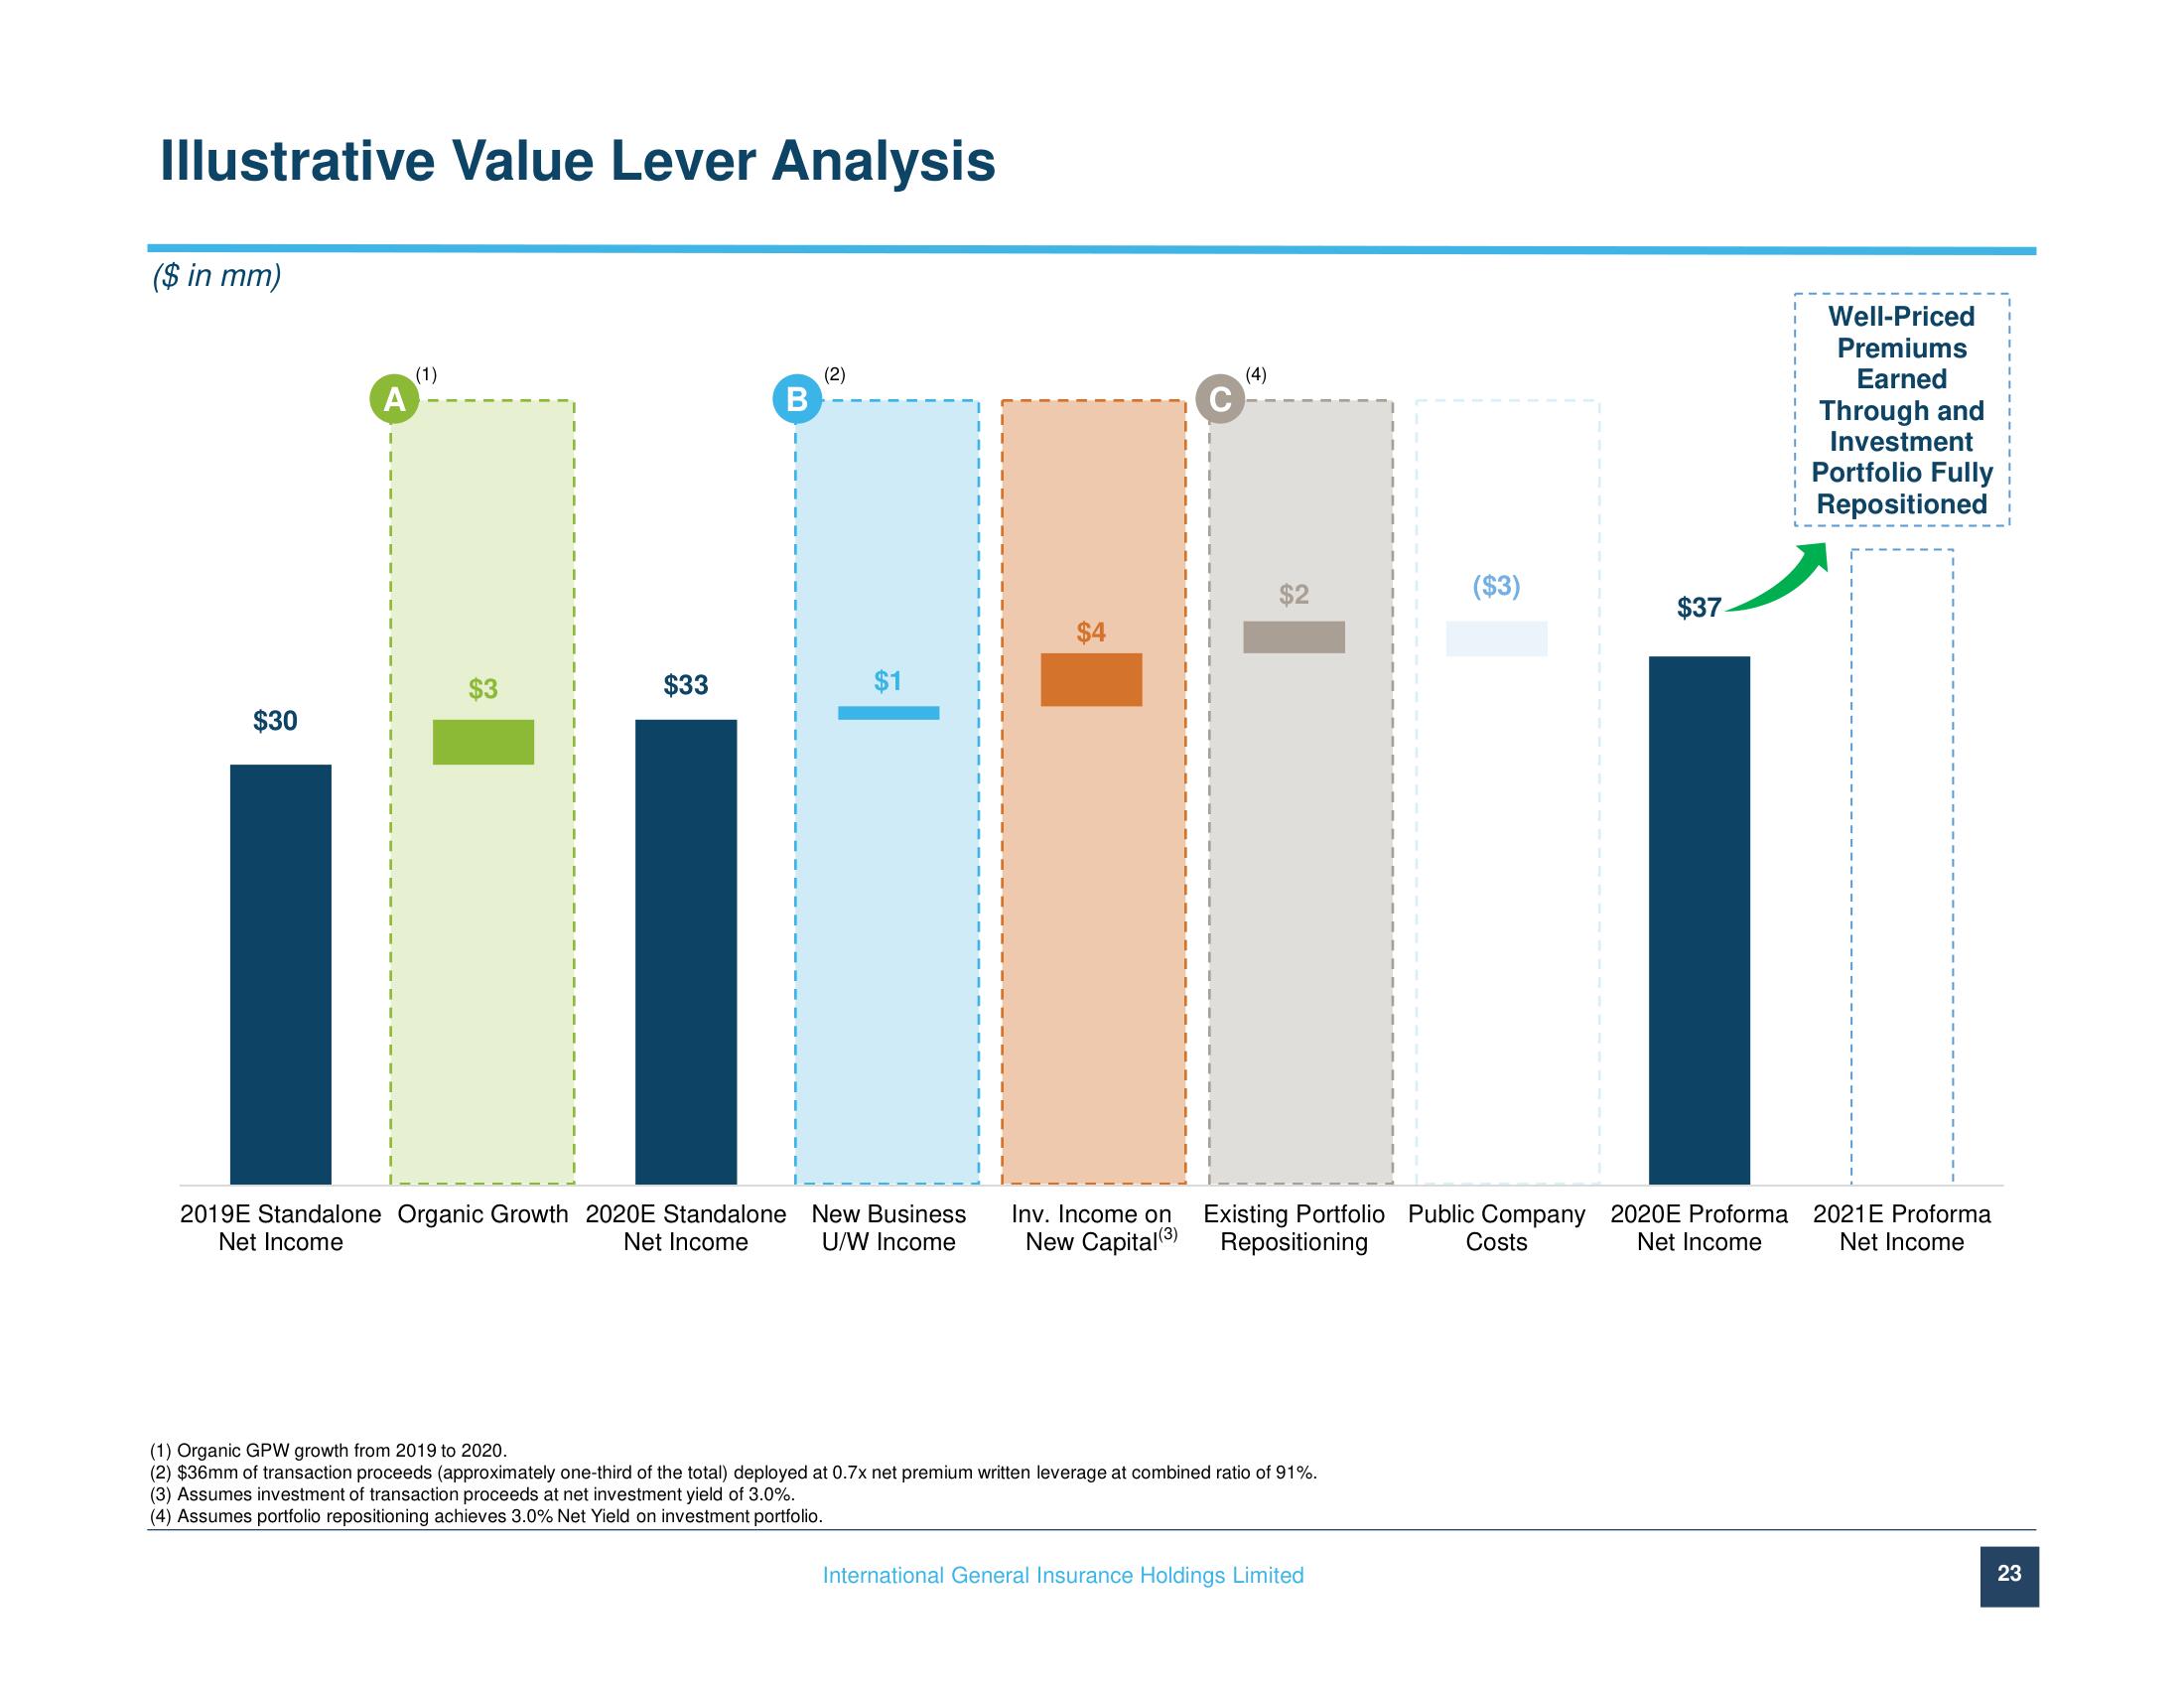
Illustrative Value Lever Analysis
($ in mm)
$30
A
(1)
I
I
I
I
1
I
I
1
I
I
I
I
I
I
I
1
I
I
I
I
I
1
I
I
I
$33
B
I
I
I
T
I
I
(2)
$1
2019E Standalone Organic Growth 2020E Standalone New Business
Net Income
Net Income
U/W Income
Inv. Income on
New Capital (3)
$2
Existing Portfolio Public Company
Repositioning
Costs
(1) Organic GPW growth from 2019 to 2020.
(2) $36mm of transaction proceeds (approximately one-third of the total) deployed at 0.7x net premium written leverage at combined ratio of 91%.
(3) Assumes investment of transaction proceeds at net investment yield of 3.0%.
(4) Assumes portfolio repositioning achieves 3.0% Net Yield on investment portfolio.
($3)
International General Insurance Holdings Limited
1
$37
2020E Proforma
Net Income
Well-Priced
Premiums
Earned
Through and
Investment
Portfolio Fully
Repositioned
2021 E Proforma
Net Income
23View entire presentation