Sonos Results Presentation Deck
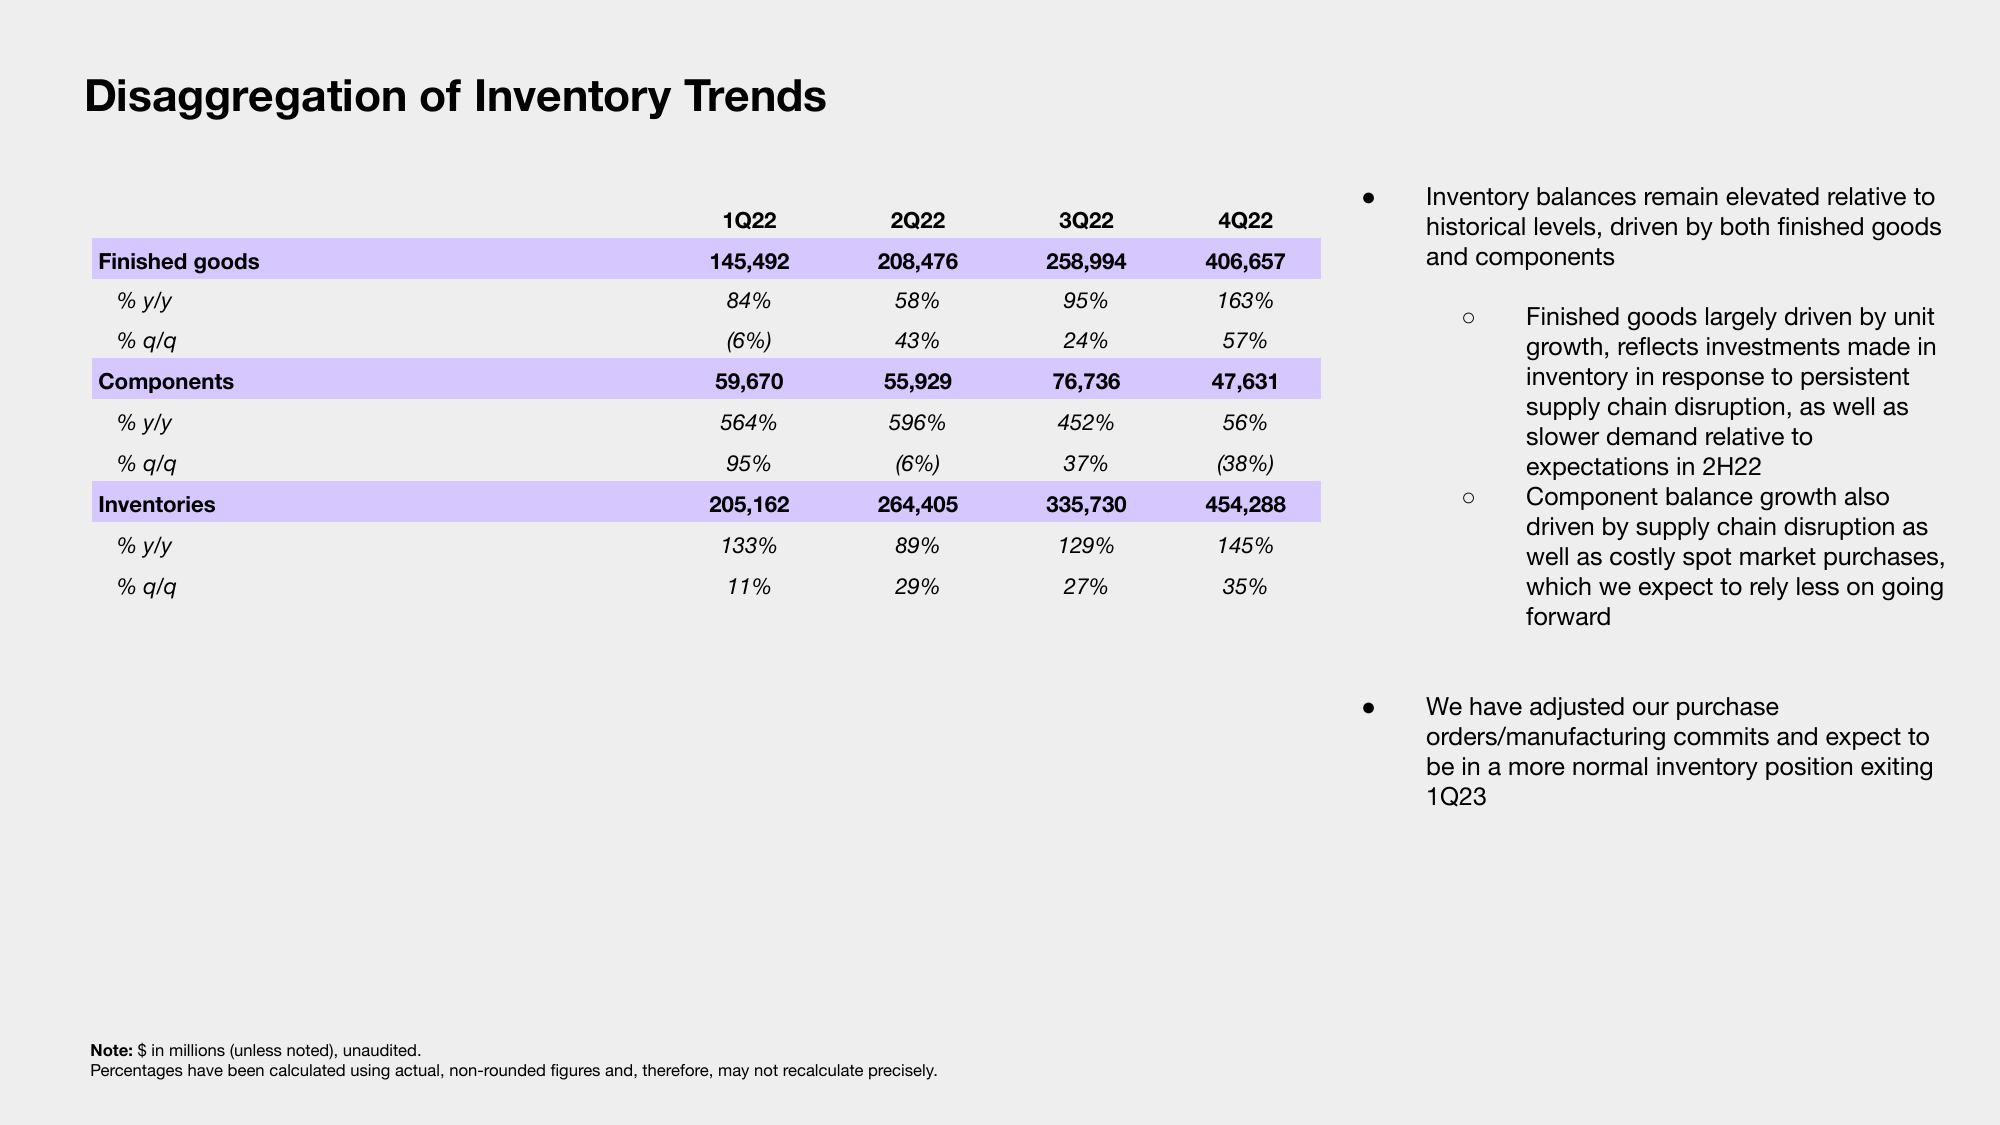
Disaggregation of Inventory Trends
Finished goods
% y/y
% q/q
Components
% y/y
% q/q
Inventories
% y/y
% q/q
1Q22
145,492
84%
(6%)
59,670
564%
95%
205,162
133%
11%
2Q22
208,476
58%
43%
55,929
596%
(6%)
264,405
89%
29%
Note: $ in millions (unless noted), unaudited.
Percentages have been calculated using actual, non-rounded figures and, therefore, may not recalculate precisely.
3Q22
258,994
95%
24%
76,736
452%
37%
335,730
129%
27%
4Q22
406,657
163%
57%
47,631
56%
(38%)
454,288
145%
35%
Inventory balances remain elevated relative to
historical levels, driven by both finished goods
and components
Finished goods largely driven by unit
growth, reflects investments made in
inventory in response to persistent
supply chain disruption, as well as
slower demand relative to
expectations in 2H22
Component balance growth also
driven by supply chain disruption as
well as costly spot market purchases,
which we expect to rely less on going
forward
We have adjusted our purchase
orders/manufacturing commits and expect to
be in a more normal inventory position exiting
1Q23View entire presentation