Deutsche Bank Results Presentation Deck
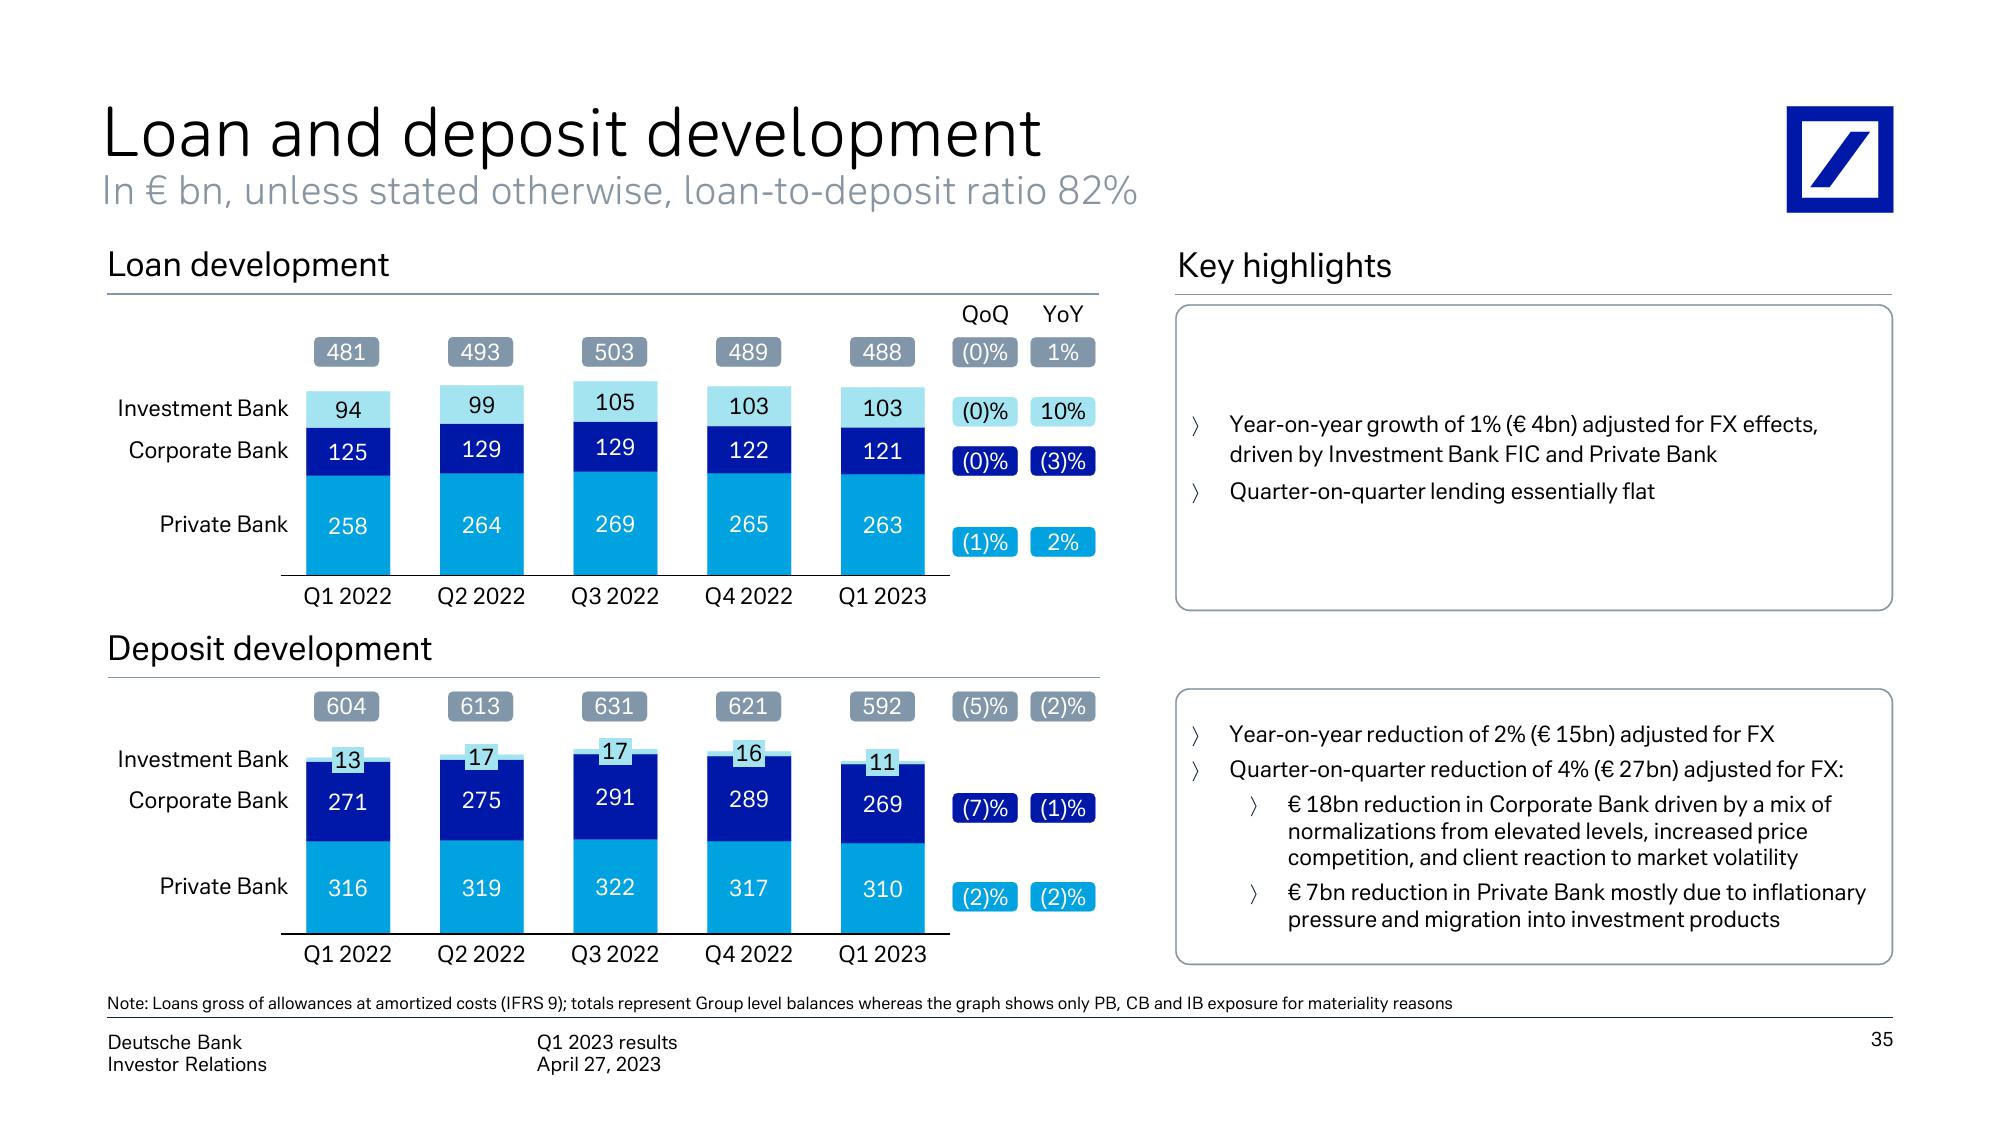
Loan and deposit development
In € bn, unless stated otherwise, loan-to-deposit ratio 82%
Loan development
481
Investment Bank 94
Corporate Bank 125
Private Bank 258
Q1 2022
Deposit development
604
Investment Bank
Corporate Bank
13,
271
Private Bank 316
493
99
129
264
Q2 2022
613
17
275
319
503
105
129
269
Q3 2022
631
17
291
322
489
103
122
265
Q4 2022
621
16
289
317
488
103
121
263
Q1 2023
592
11
269
310
YoY
QoQ
(0)% 1%
(0)%
(0)% (3)
10%
(1)% 2%
(5)% (2)%
(7)% (1)%
(2)% (2)%
Key highlights
/
Year-on-year growth of 1% (€ 4bn) adjusted for FX effects,
driven by Investment Bank FIC and Private Bank
Quarter-on-quarter lending essentially flat
Year-on-year reduction of 2% (€ 15bn) adjusted for FX
Quarter-on-quarter reduction of 4% (€ 27bn) adjusted for FX:
>
€ 18bn reduction in Corporate Bank driven by a mix of
normalizations from elevated levels, increased price
competition, and client reaction to market volatility
>
€ 7bn reduction in Private Bank mostly due to inflationary
pressure and migration into investment products
Q1 2022
Q2 2022
Q3 2022
Q4 2022 Q1 2023
Note: Loans gross of allowances at amortized costs (IFRS 9); totals represent Group level balances whereas the graph shows only PB, CB and IB exposure for materiality reasons
Deutsche Bank
Investor Relations
Q1 2023 results
April 27, 2023
35View entire presentation