ads-tec Energy SPAC Presentation Deck
Operational benchmarking
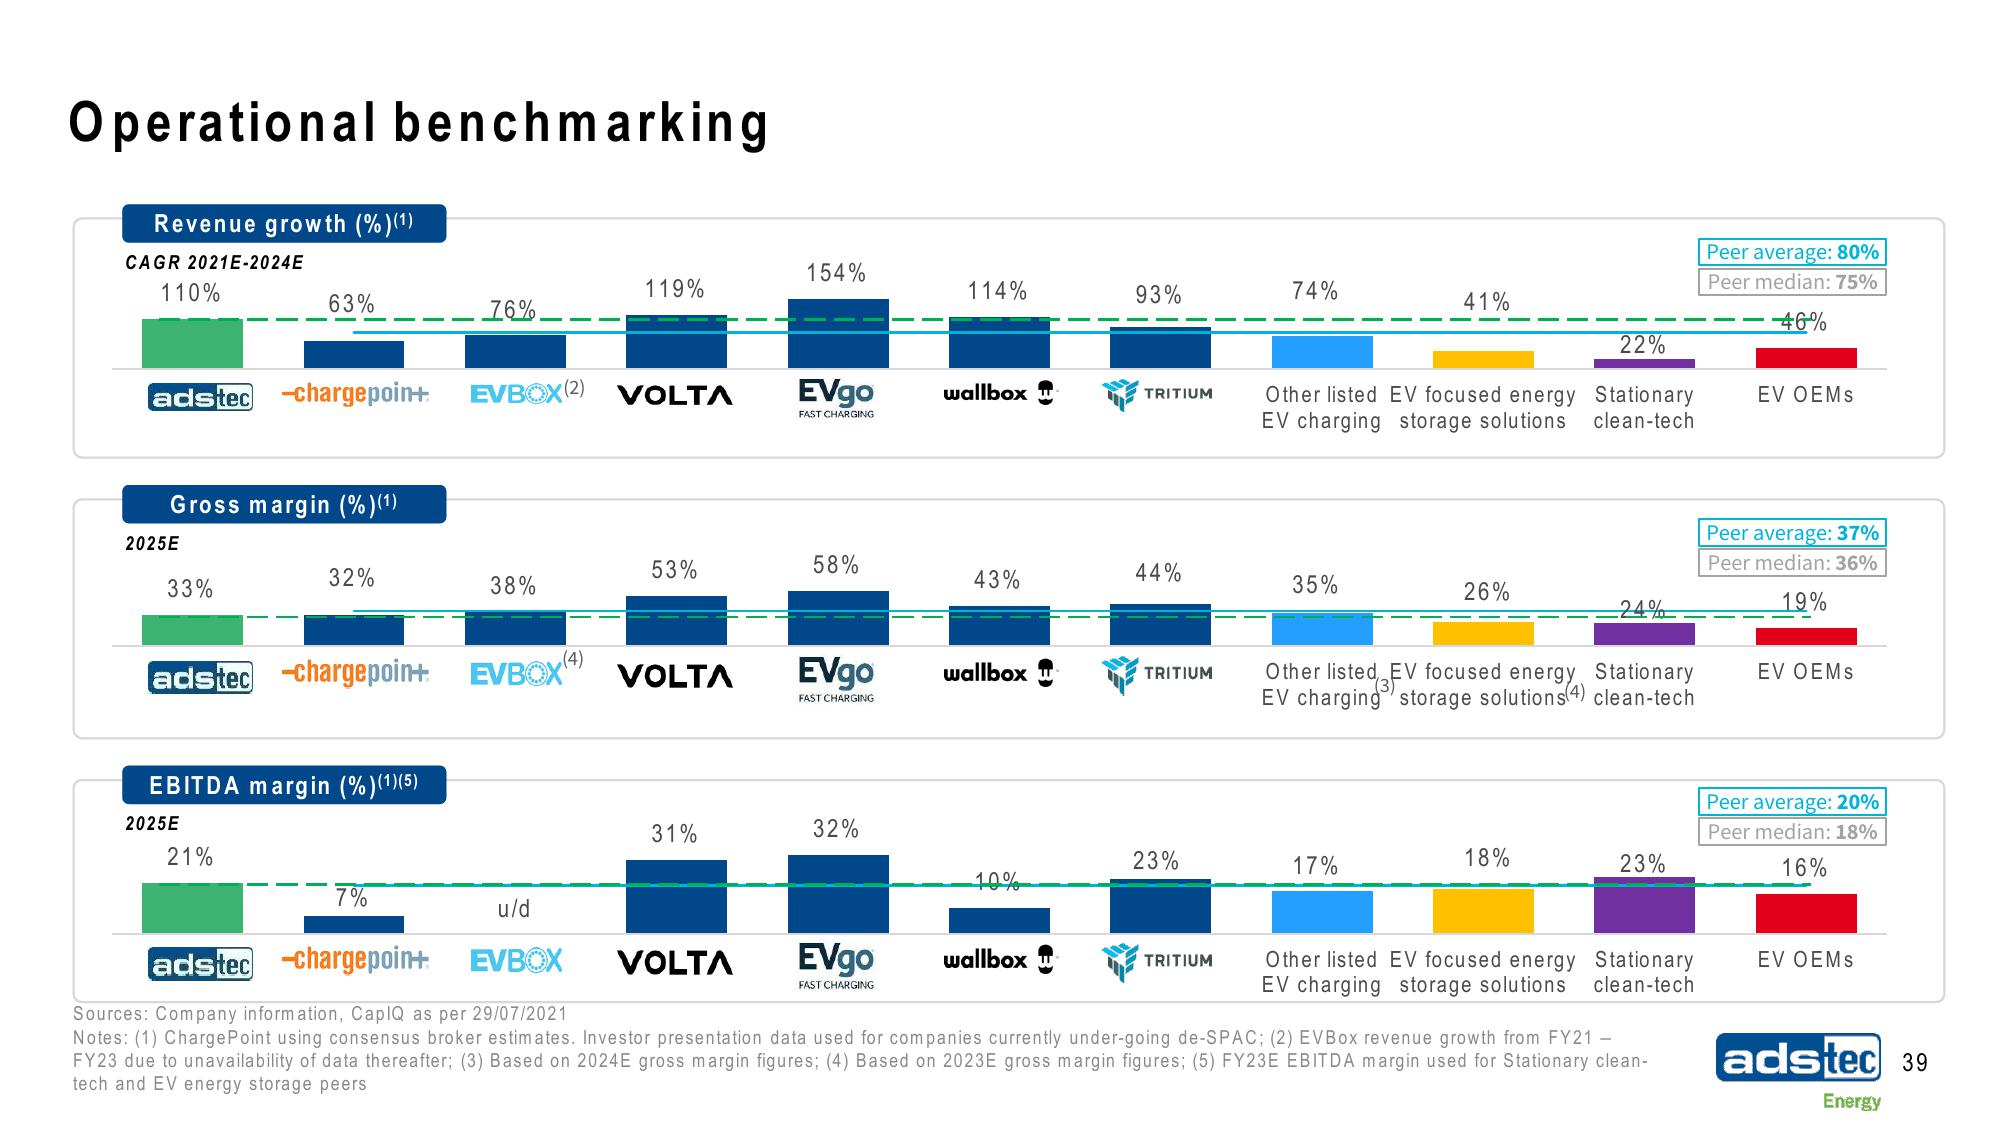
Revenue growth (%)(¹)
CAGR 2021E-2024E
110%
adstec -chargepoin+
Gross margin (%)(1)
2025E
33%
63%
adstec -chargepoin+
2025E
32%
EBITDA margin (%)(1)(5)
21%
7%
76%
EVBOX (2)
38%
EVBOX
(4)
119%
VOLTA
53%
VOLTA
31%
154%
VOLTA
EVgo
FAST CHARGING
58%
EVgo
FAST CHARGING
32%
114%
EVgo
FAST CHARGING
wallbox
43%
wallbox
10%
93%
wallbox
TRITIUM
44%
TRITIUM
23%
74%
TRITIUM
Other listed EV focused energy
EV charging storage solutions
35%
41%
17%
26%
22%
Stationary
clean-tech
Other listed EV focused energy Stationary
EV charging storage solutions(4) clean-tech
18%
u/d
adstec -chargepoin+
EVBOX
Sources: Company information, CapIQ as per 29/07/2021
Notes: (1) ChargePoint using consensus broker estimates. Investor presentation data used for companies currently under-going de-SPAC; (2) EVBox revenue growth from FY21 -
FY23 due to unavailability of data thereafter; (3) Based on 2024E gross margin figures; (4) Based on 2023E gross margin figures; (5) FY23E EBITDA margin used for Stationary clean-
tech and EV energy storage peers
-24%
23%
Other listed EV focused energy Stationary
EV charging storage solutions clean-tech
Peer average: 80%
Peer median: 75%
-46%
EV OEMS
Peer average: 37%
Peer median: 36%
19%
EV OEMs
Peer average: 20%
Peer median: 18%
16%
EV OEMs
adstec 39
EnergyView entire presentation