Tradeweb Investor Presentation Deck
Balancing Investment to Drive Revenues & Margins
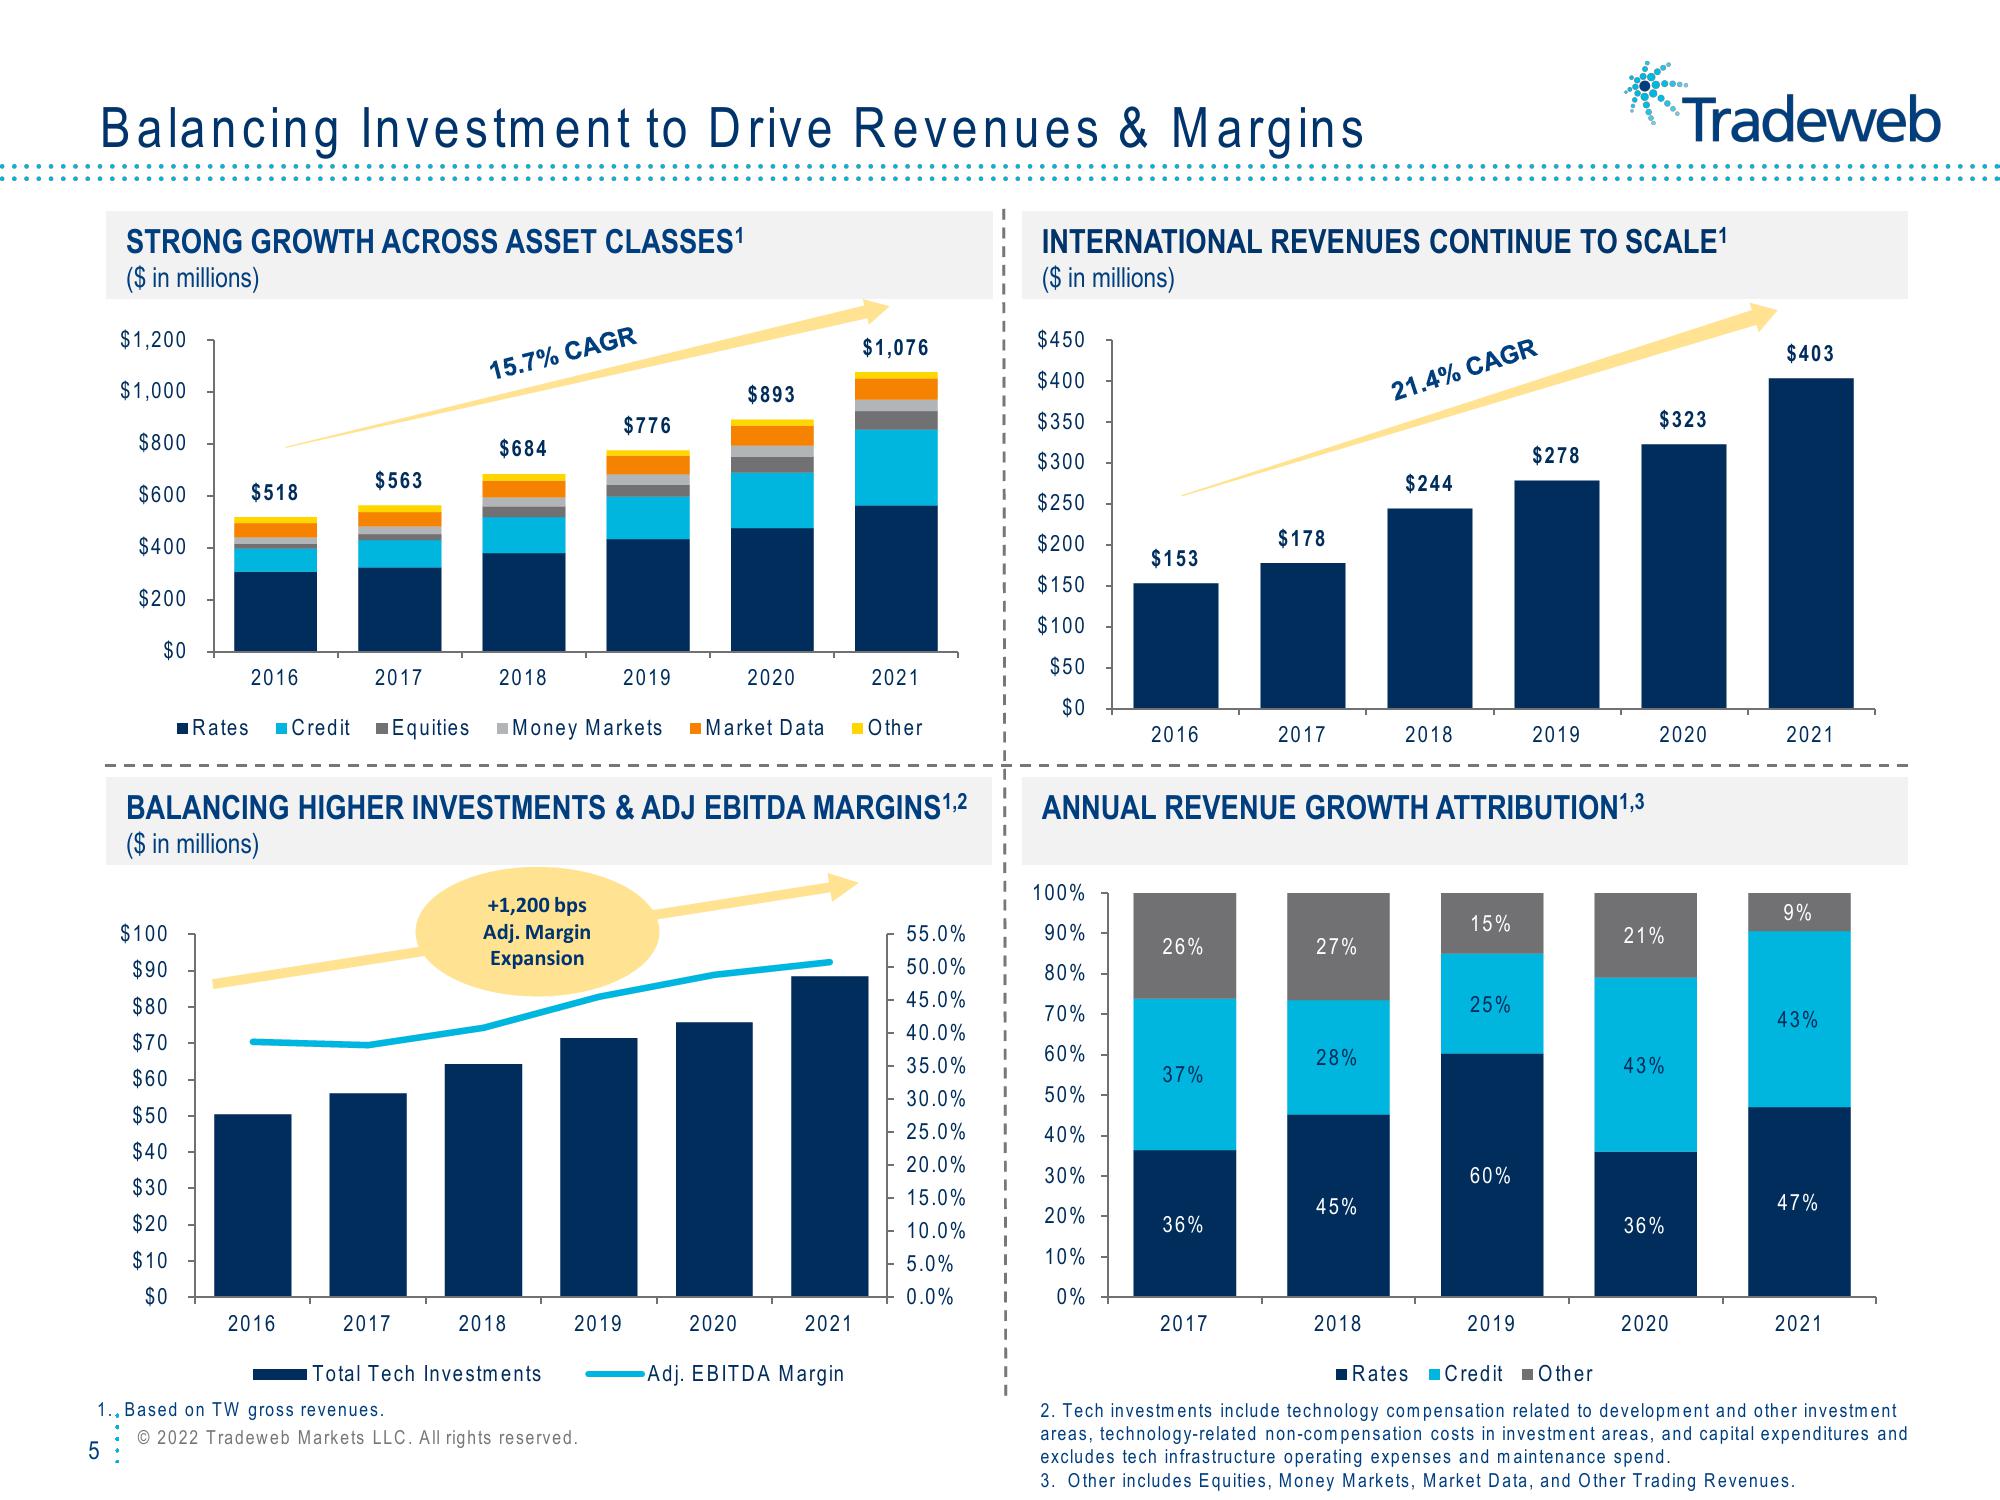
STRONG GROWTH ACROSS ASSET CLASSES¹
($ in millions)
$1,200
$1,000
$800
$600
$400
$200
$0
Rates
$100
$90
$80
$70
$60
$50
$40
$30
$20
$10
$0
$518
2016
$563
2016
2017
15.7% CAGR
$684
2017
2018
+1,200 bps
Adj. Margin
Expansion
BALANCING HIGHER INVESTMENTS & ADJ EBITDA MARGINS 1,2
($ in millions)
2018
2021
Credit Equities Money Markets Market Data Other
Total Tech Investments
$776
2019
2019
1.. Based on TW gross revenues.
Ⓒ2022 Tradeweb Markets LLC. All rights reserved.
5
$893
2020
2020
$1,076
2021
Adj. EBITDA Margin
I
I
I
I
I
$450
$400
$350
$300
$250
$200
$150
$100
$50
$0
1 100%
90%
80%
70%
1 60%
I
INTERNATIONAL REVENUES CONTINUE TO SCALE¹
($ in millions)
55.0%
50.0%
45.0% I
40.0% 1
35.0%
30.0%
25.0%
50%
40%
20.0% 1
30%
15.0% I
20%
10.0%
5.0% I 10%
I
0.0%
I
0%
$153
2016
26%
37%
36%
$178
2017
2017
ANNUAL REVENUE GROWTH ATTRIBUTION1,3
27%
28%
45%
21.4% CAGR
2018
$244
2018
15%
25%
60%
$278
2019
2019
....
$323
2020
21%
Tradeweb
43%
36%
2020
$403
2021
9%
43%
47%
2021
Rates Credit Other
2. Tech investments include technology compensation related to development and other investment
areas, technology-related non-compensation costs in investment areas, and capital expenditures and
excludes tech infrastructure operating expenses and maintenance spend.
3. Other includes Equities, Money Markets, Market Data, and Other Trading Revenues.View entire presentation