Evotec Results Presentation Deck
in € m¹)
evotec
Revenues from contracts with customers
Gross margin
●
R&D expenses
• SG&A expenses
Impairment of intangible assets
Impairment of goodwill
• Other op. income (expenses), net
Operating result
Adjusted Group EBITDA²)
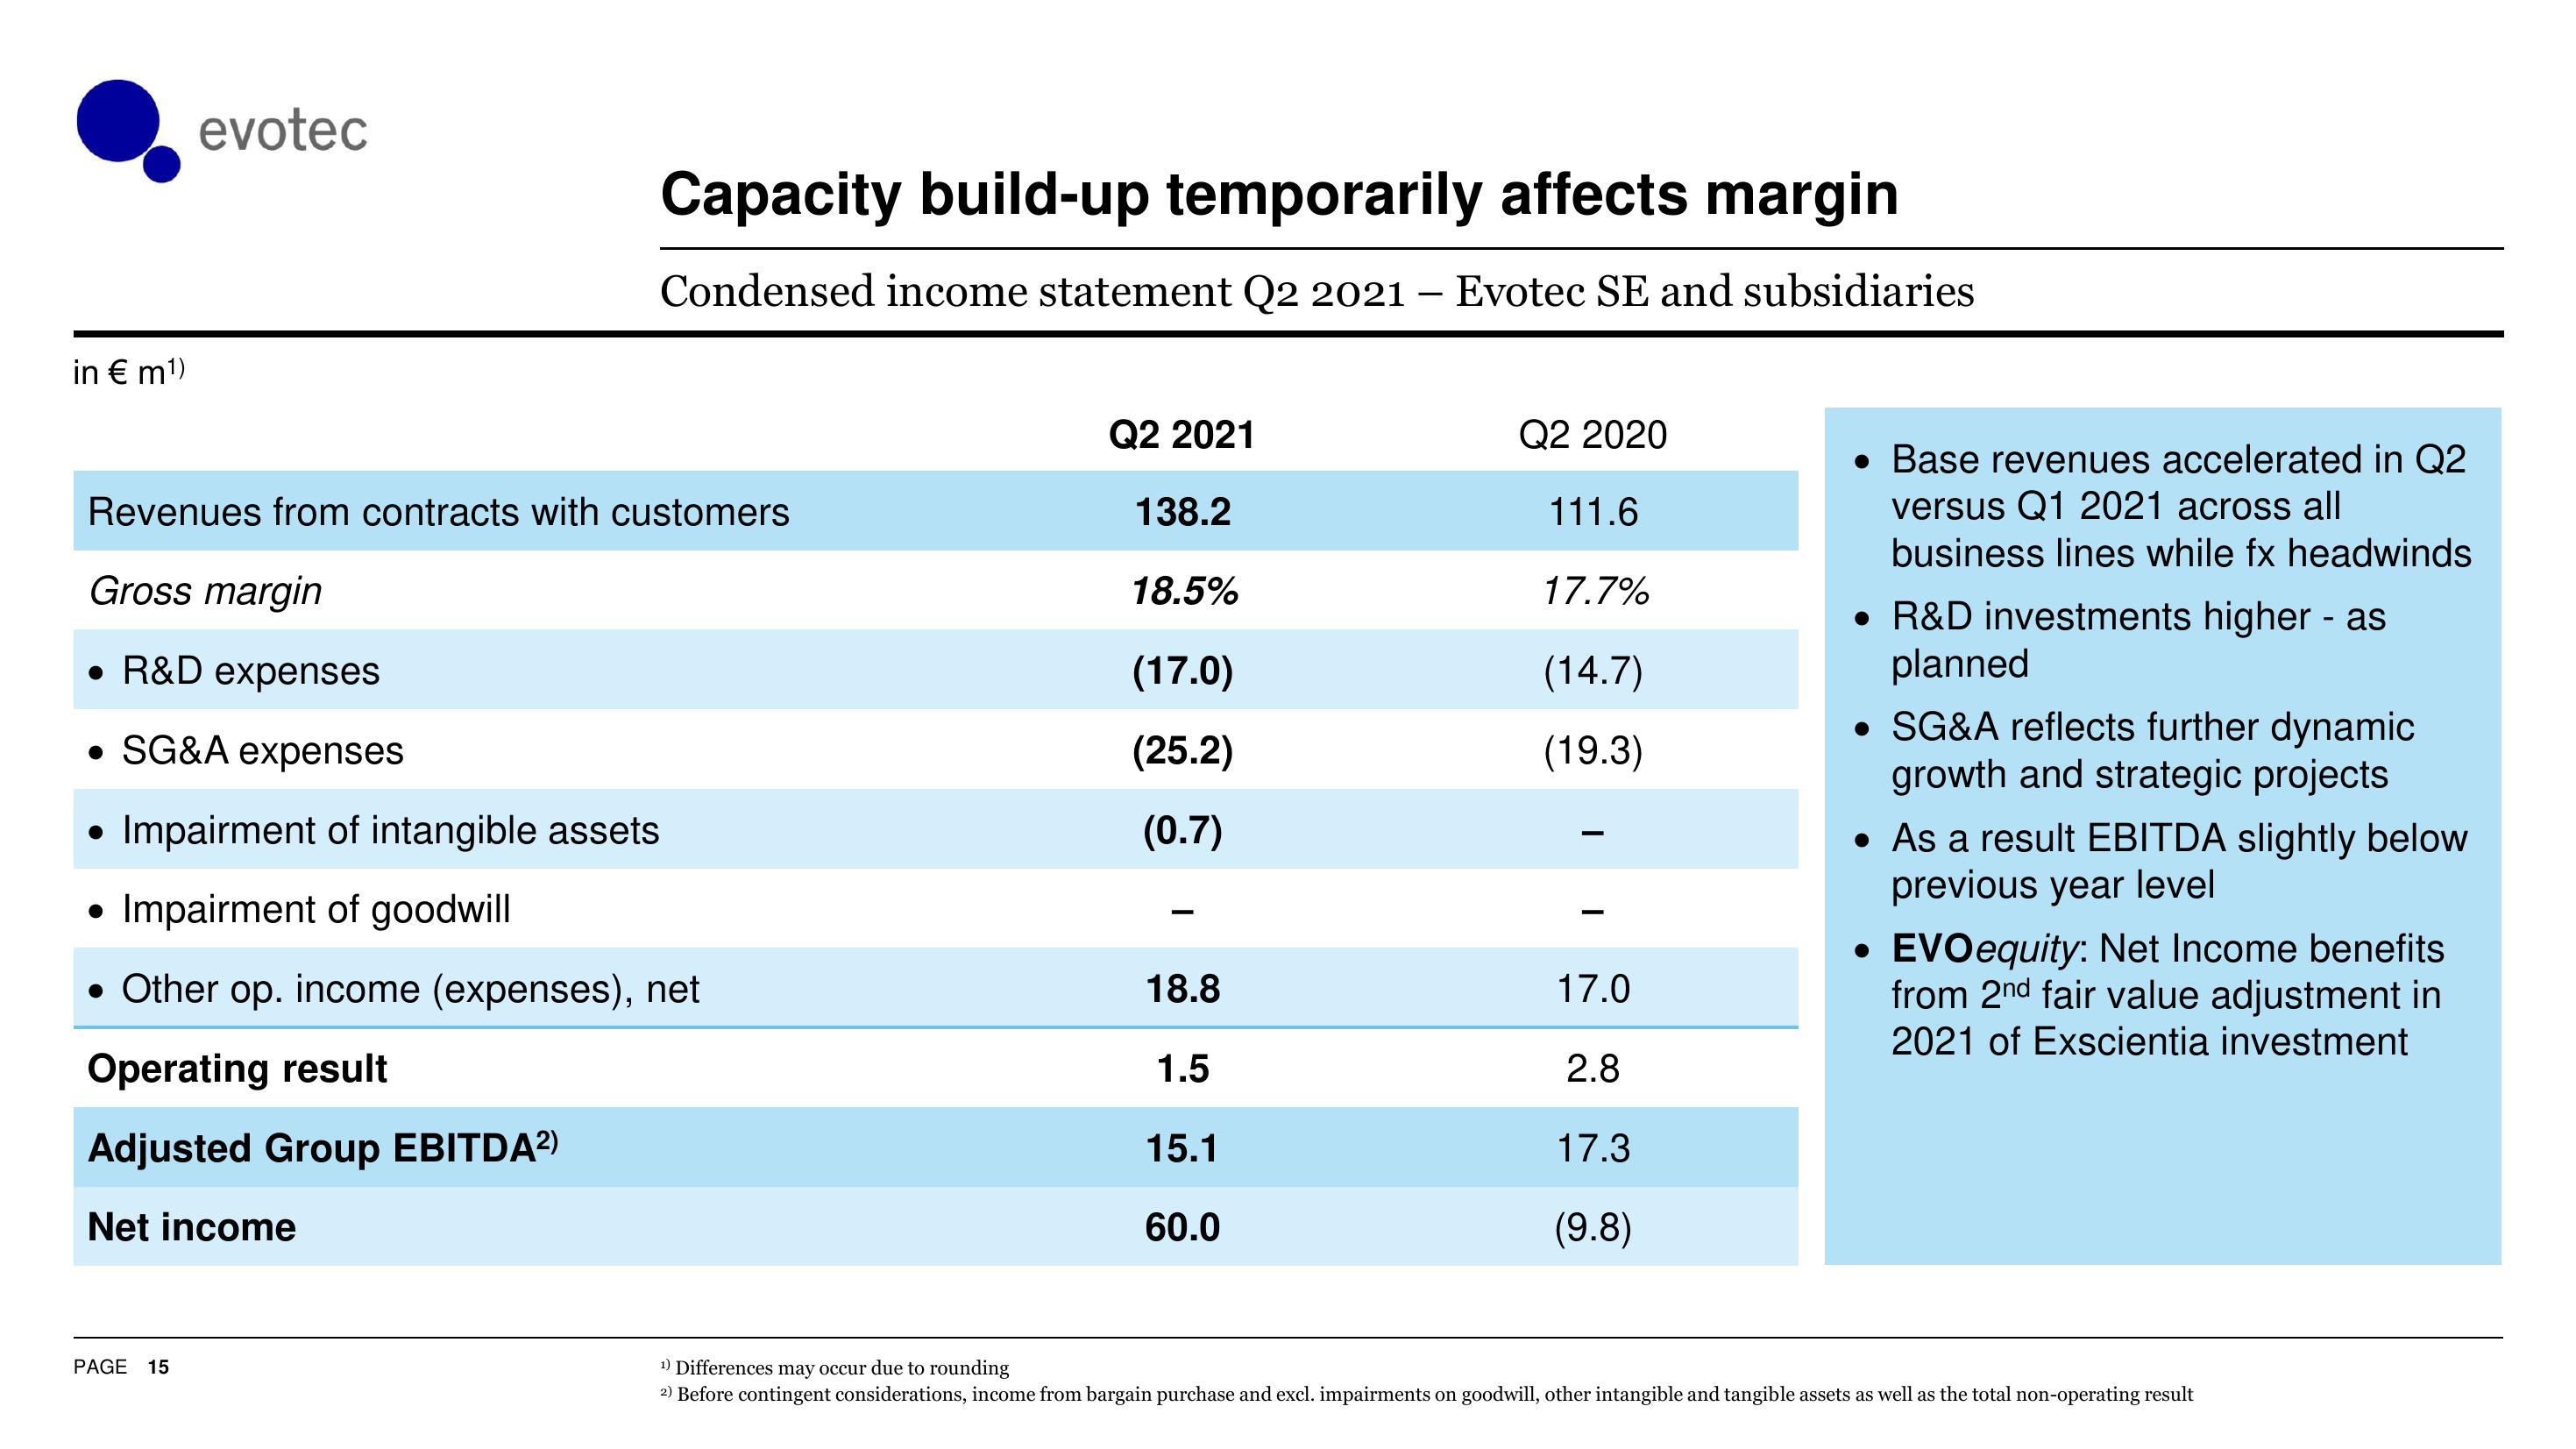
Capacity build-up temporarily affects margin
Condensed income statement Q2 2021 - Evotec SE and subsidiaries
Net income
PAGE 15
Q2 2021
138.2
18.5%
(17.0)
(25.2)
(0.7)
18.8
1.5
15.1
60.0
Q2 2020
111.6
17.7%
(14.7)
(19.3)
17.0
2.8
17.3
(9.8)
• Base revenues accelerated in Q2
versus Q1 2021 across all
business lines while fx headwinds
• R&D investments higher - as
planned
• SG&A reflects further dynamic
growth and strategic projects
• As a result EBITDA slightly below
previous year level
EVO equity: Net Income benefits
from 2nd fair value adjustment in
2021 of Exscientia investment
¹) Differences may occur due to rounding
2) Before contingent considerations, income from bargain purchase and excl. impairments on goodwill, other intangible and tangible assets as well as the total non-operating resultView entire presentation