SimCorp Investor Day Presentation Deck
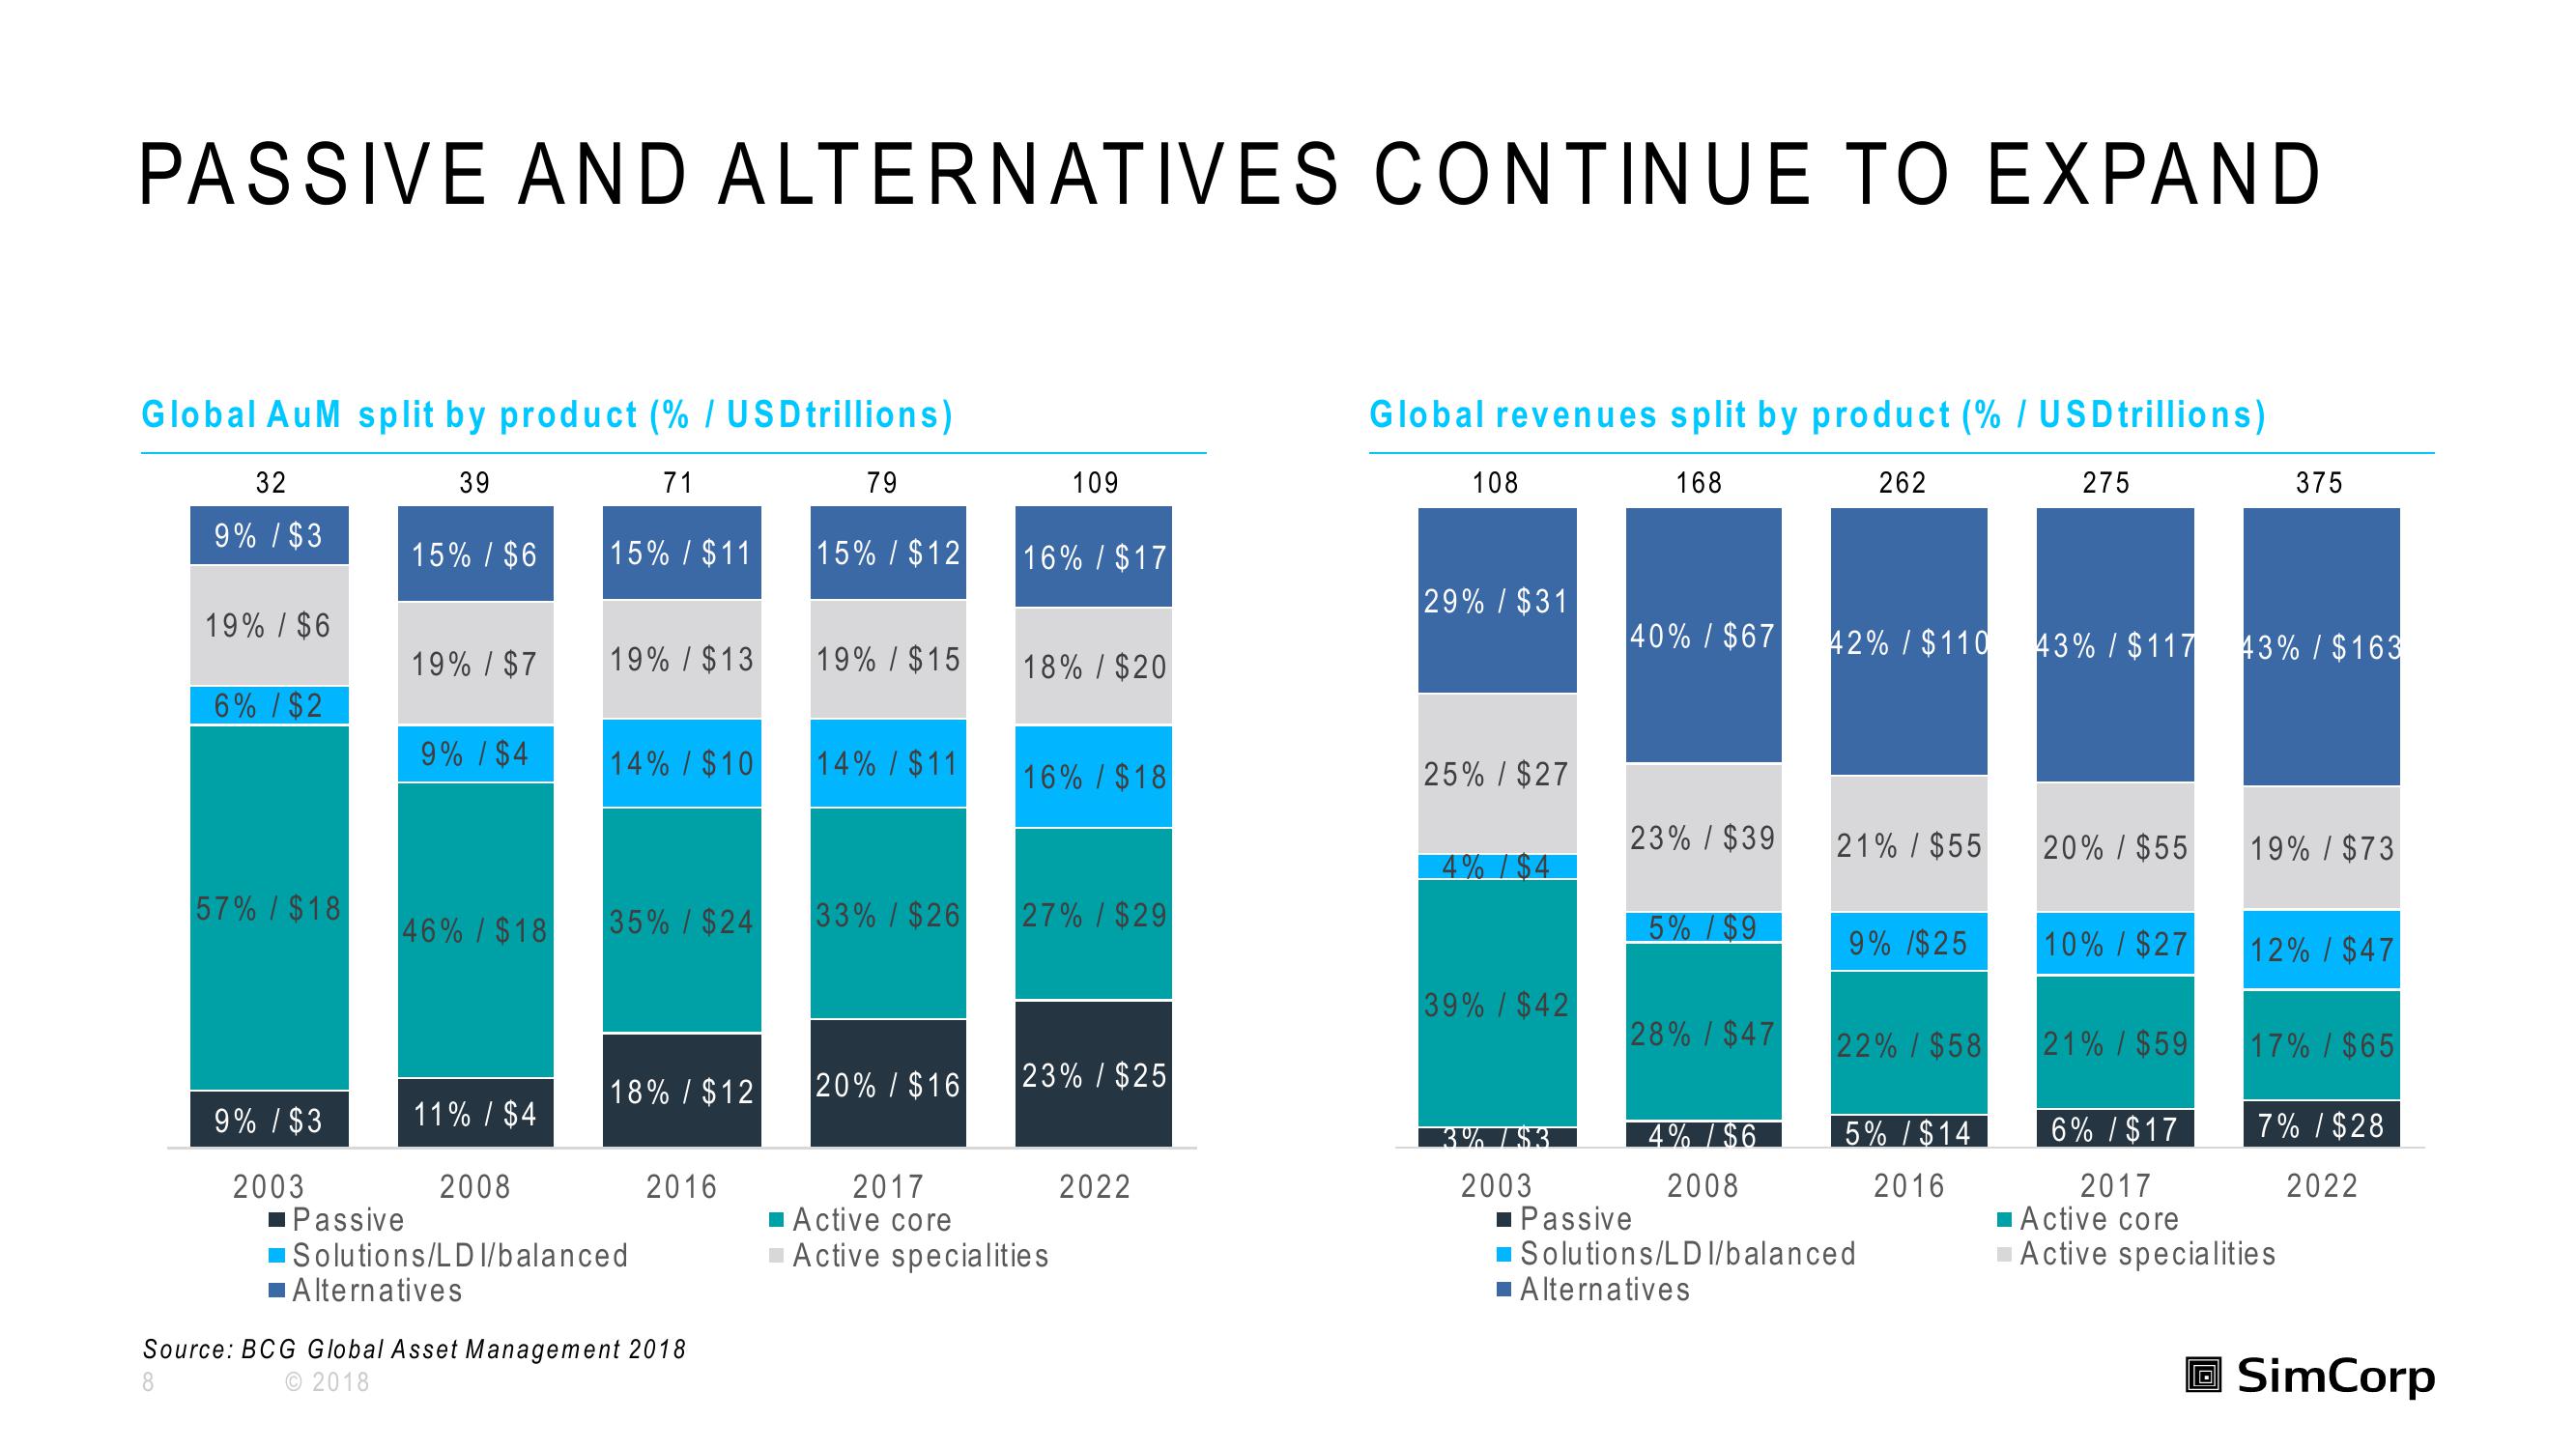
PASSIVE AND ALTERNATIVES CONTINUE TO EXPAND
Global AuM split by product (% / USD trillions)
39
71
79
32
9% / $3
19% / $6
6% / $2
57% / $18
9% / $3
2003
15% / $6
19% / $7
9% / $4
46% / $18
11% / $4
2008
15% / $11
19% / $13
14% / $10
35% / $24
18% / $12
Passive
Solutions/LD I/balanced
■Alternatives
2016
Source: BCG Global Asset Management 2018
8
©2018
15% / $12
19% / $15
14% / $11
33% / $26
20% / $16
2017
■Active core
109
16% / $17
18% / $20
16% / $18
27%/$29
23% / $25
Active specialities
2022
Global revenues split by product (% / USD trillions)
168
108
29% / $31
25% / $27
4%
39% / $42
3% $3
2003
40% / $67
23% / $39
5% / $9
28% / $47
4% /$6
2008
262
21% / $55
42% / $110 43% / $117 43% / $163
9% /$25
22% / $58
5% / $14
2016
Passive
Solutions/LD I/balanced
■Alternatives
275
20% / $55
10% / $27
21% / $59
375
19% / $73
12% / $47
17%/$65
6% / $17
2017
■Active core
Active specialities
7% / $28
2022
SimCorpView entire presentation