Bakkt Results Presentation Deck
NOTES
Statement
of
operations
A
$mm's
Revenues:
Net revenues¹
Operating expenses:
Compensation and benefits
Professional services
Technology and communication
Selling, general and administrative
Acquisition-related expenses
Depreciation and amortization
Related party expenses (affiliate in Predecessor periods)²
Goodwill and intangible assets impairments
Impairment of long-lived assets
Restructuring expenses
Other operating expenses
Total operating expenses
Operating loss
Interest income (expense), net
Gain (loss) from change in fair value of warrant liability
Other income (expense), net
Loss before income taxes
Income tax benefit (expense)
Net loss
Less: Net loss attributable to noncontrolling interest
Net loss attributable to Bakkt Holdings, Inc.
Net loss per share attributable to Class A common stockholders
Basic
Diluted
4Q22
$15.6
Successor
10/15/21 -
12/31/21
31.9
2.2
4.4
8.4
4.5
7.0
0.3
271.9
11.5
2.3
0.6
345.1
(329.5)
1.0
3.5
(1.5)
(326.4)
2.5
(323.9)
(227.4)
$(96.5)
$(1.22)
$(1.24)
$11.5
62.2
3.0
3.1
8.5
1.6
5.4
0.6
1.2
0.4
86.0
(74.5)
FY22
$(0.81)
$(0.81)
$54.6
139.0
11.5
17.1
35.4
5.7
25.4
1.2
1,819.6
11.5
2.3
2.3
2,071.0
(2,016.4)
1.9
16.6
(0.9)
(1,998.8)
11.3
(79.4)
0.8
(153.1)
(11.8)
(164.8) (1,987.5)
(120.8) (1,410.1)
$(44.0) $(577.4)
$(8.11)
$(8.11)
Predecessor
10/1/21 -
10/14/21
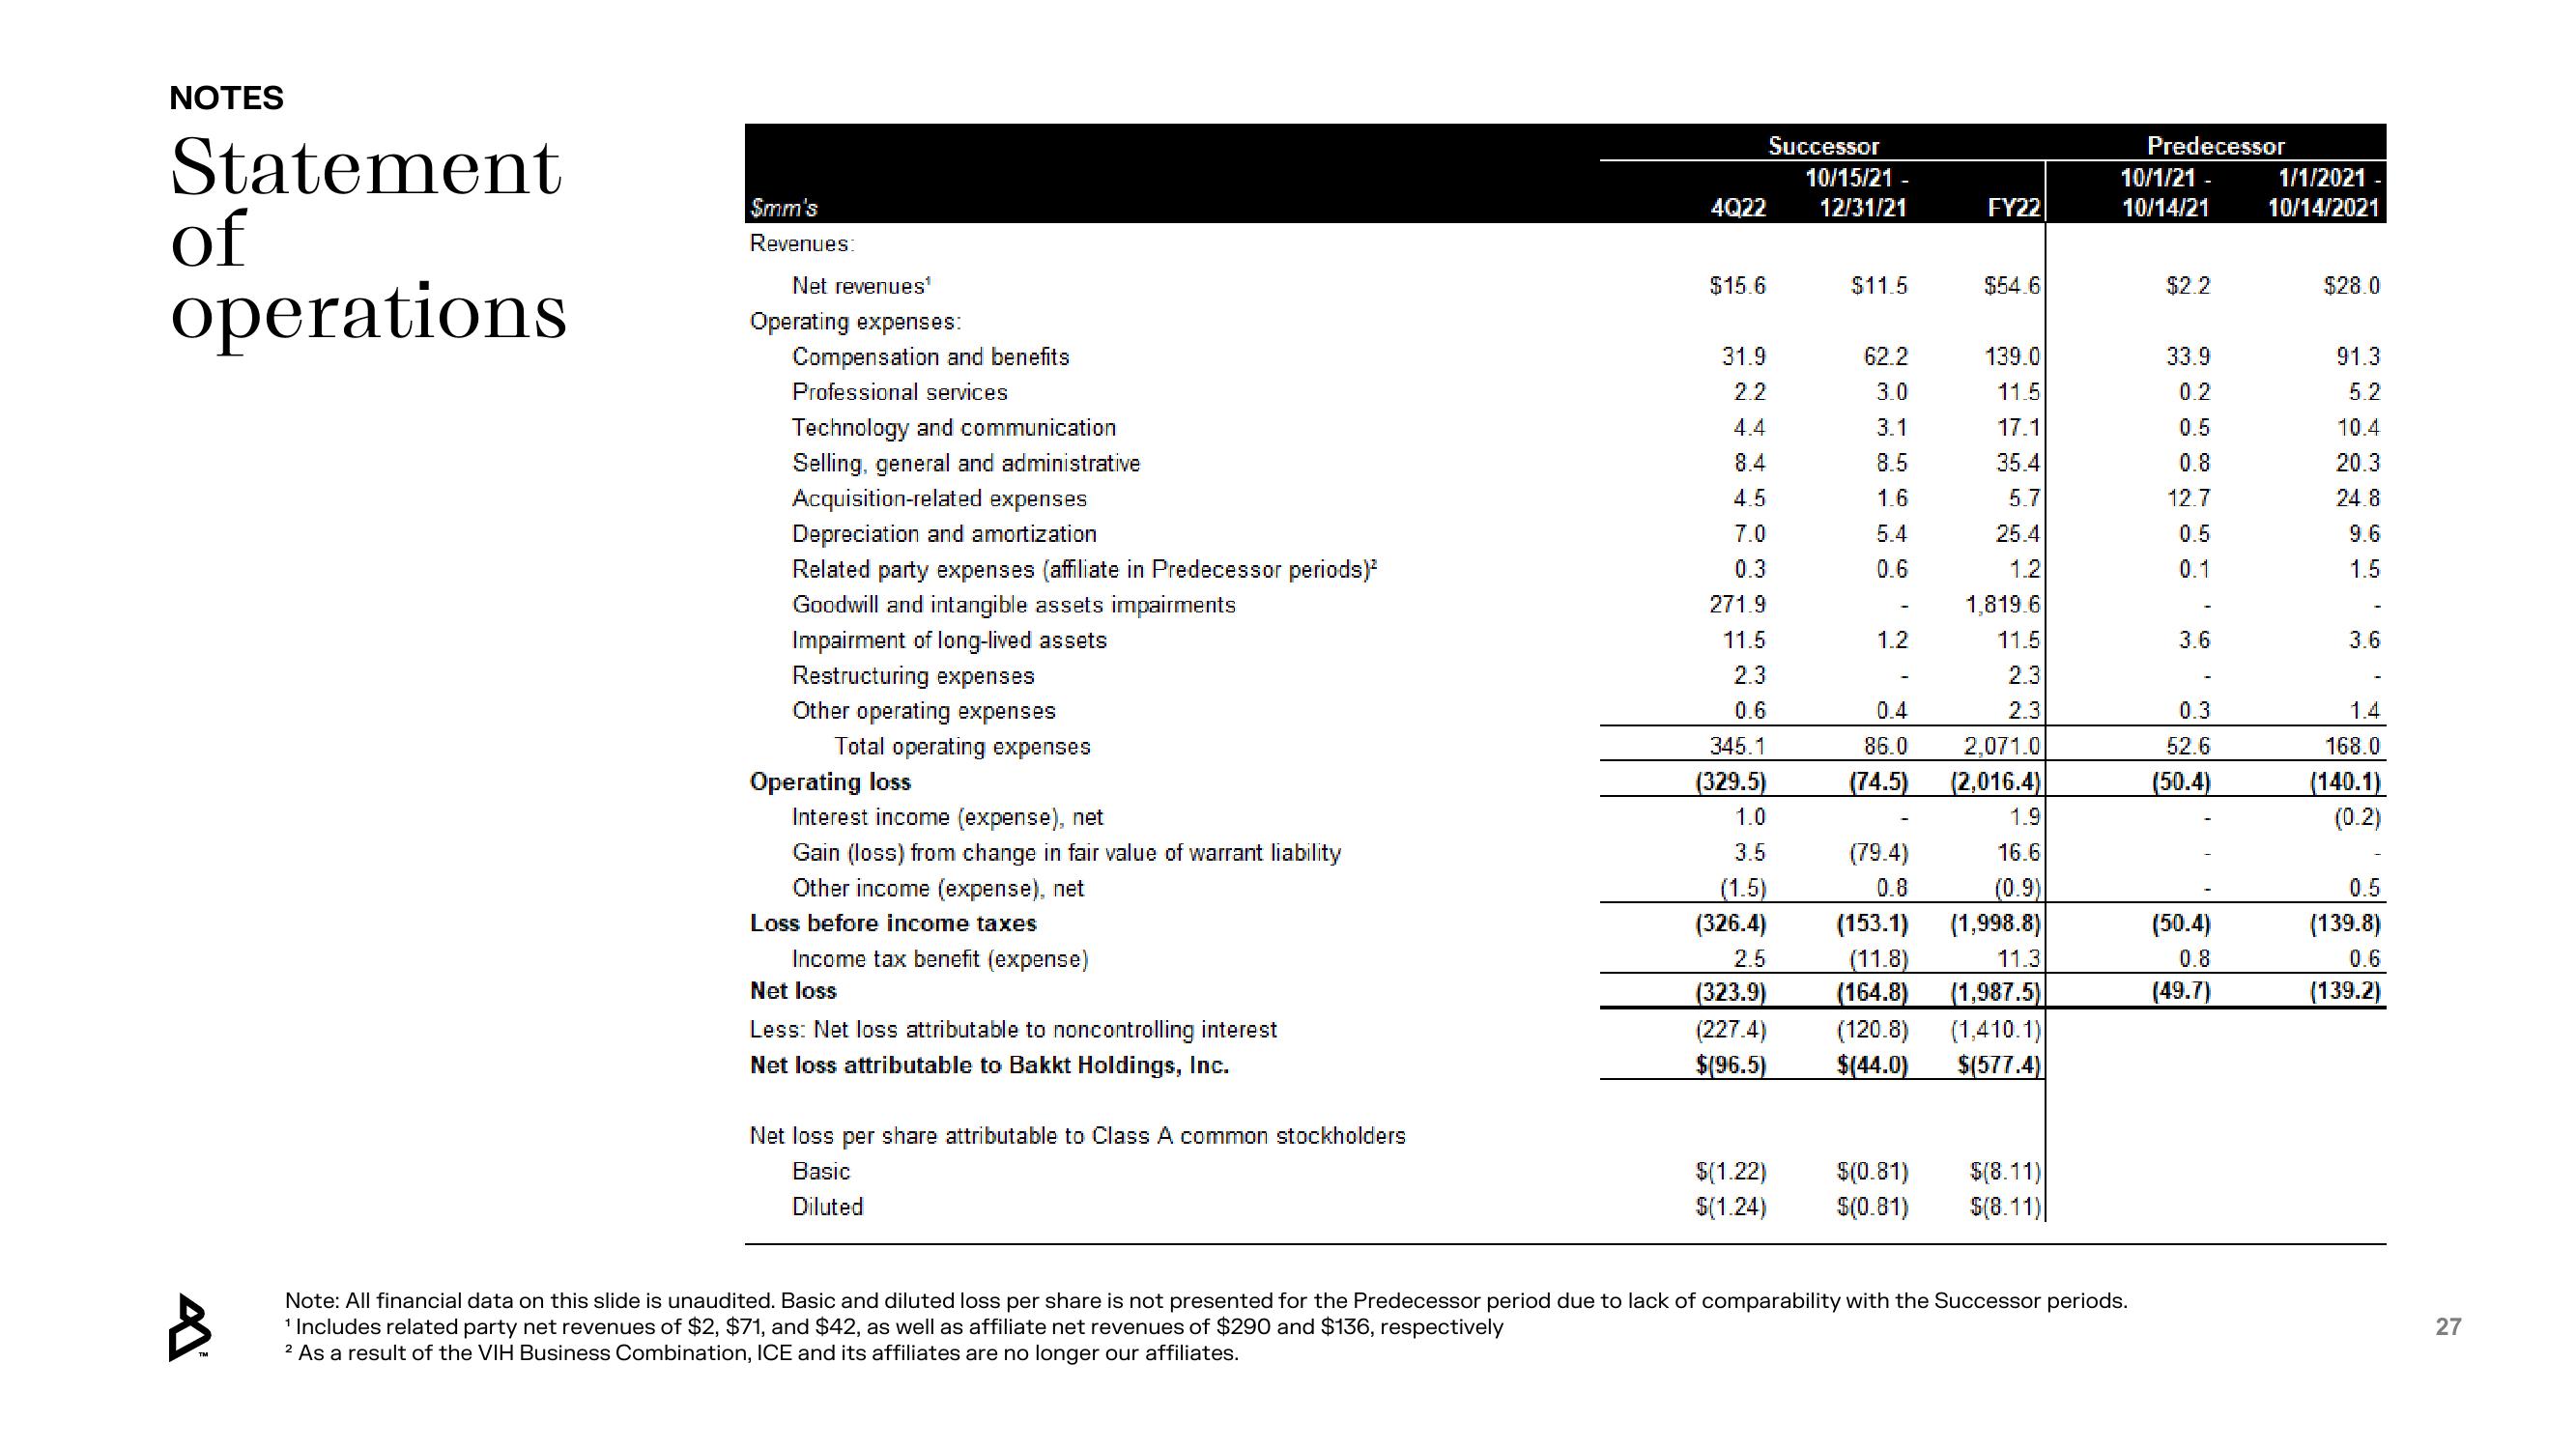
Note: All financial data on this slide is unaudited. Basic and diluted loss per share is not presented for the Predecessor period due to lack of comparability with the Successor periods.
¹ Includes related party net revenues of $2, $71, and $42, as well as affiliate net revenues of $290 and $136, respectively
2 As a result of the VIH Business Combination, ICE and its affiliates are no longer our affiliates.
$2.2
33.9
0.2
0.5
0.8
12.7
0.5
0.1
3.6
0.3
52.6
(50.4)
(50.4)
0.8
(49.7)
1/1/2021 -
10/14/2021
$28.0
91.3
5.2
10.4
20.3
24.8
9.6
1.5
3.6
1.4
168.0
(140.1)
(0.2)
0.5
(139.8)
0.6
(139.2)
27View entire presentation