Paysafe Results Presentation Deck
Leverage summary
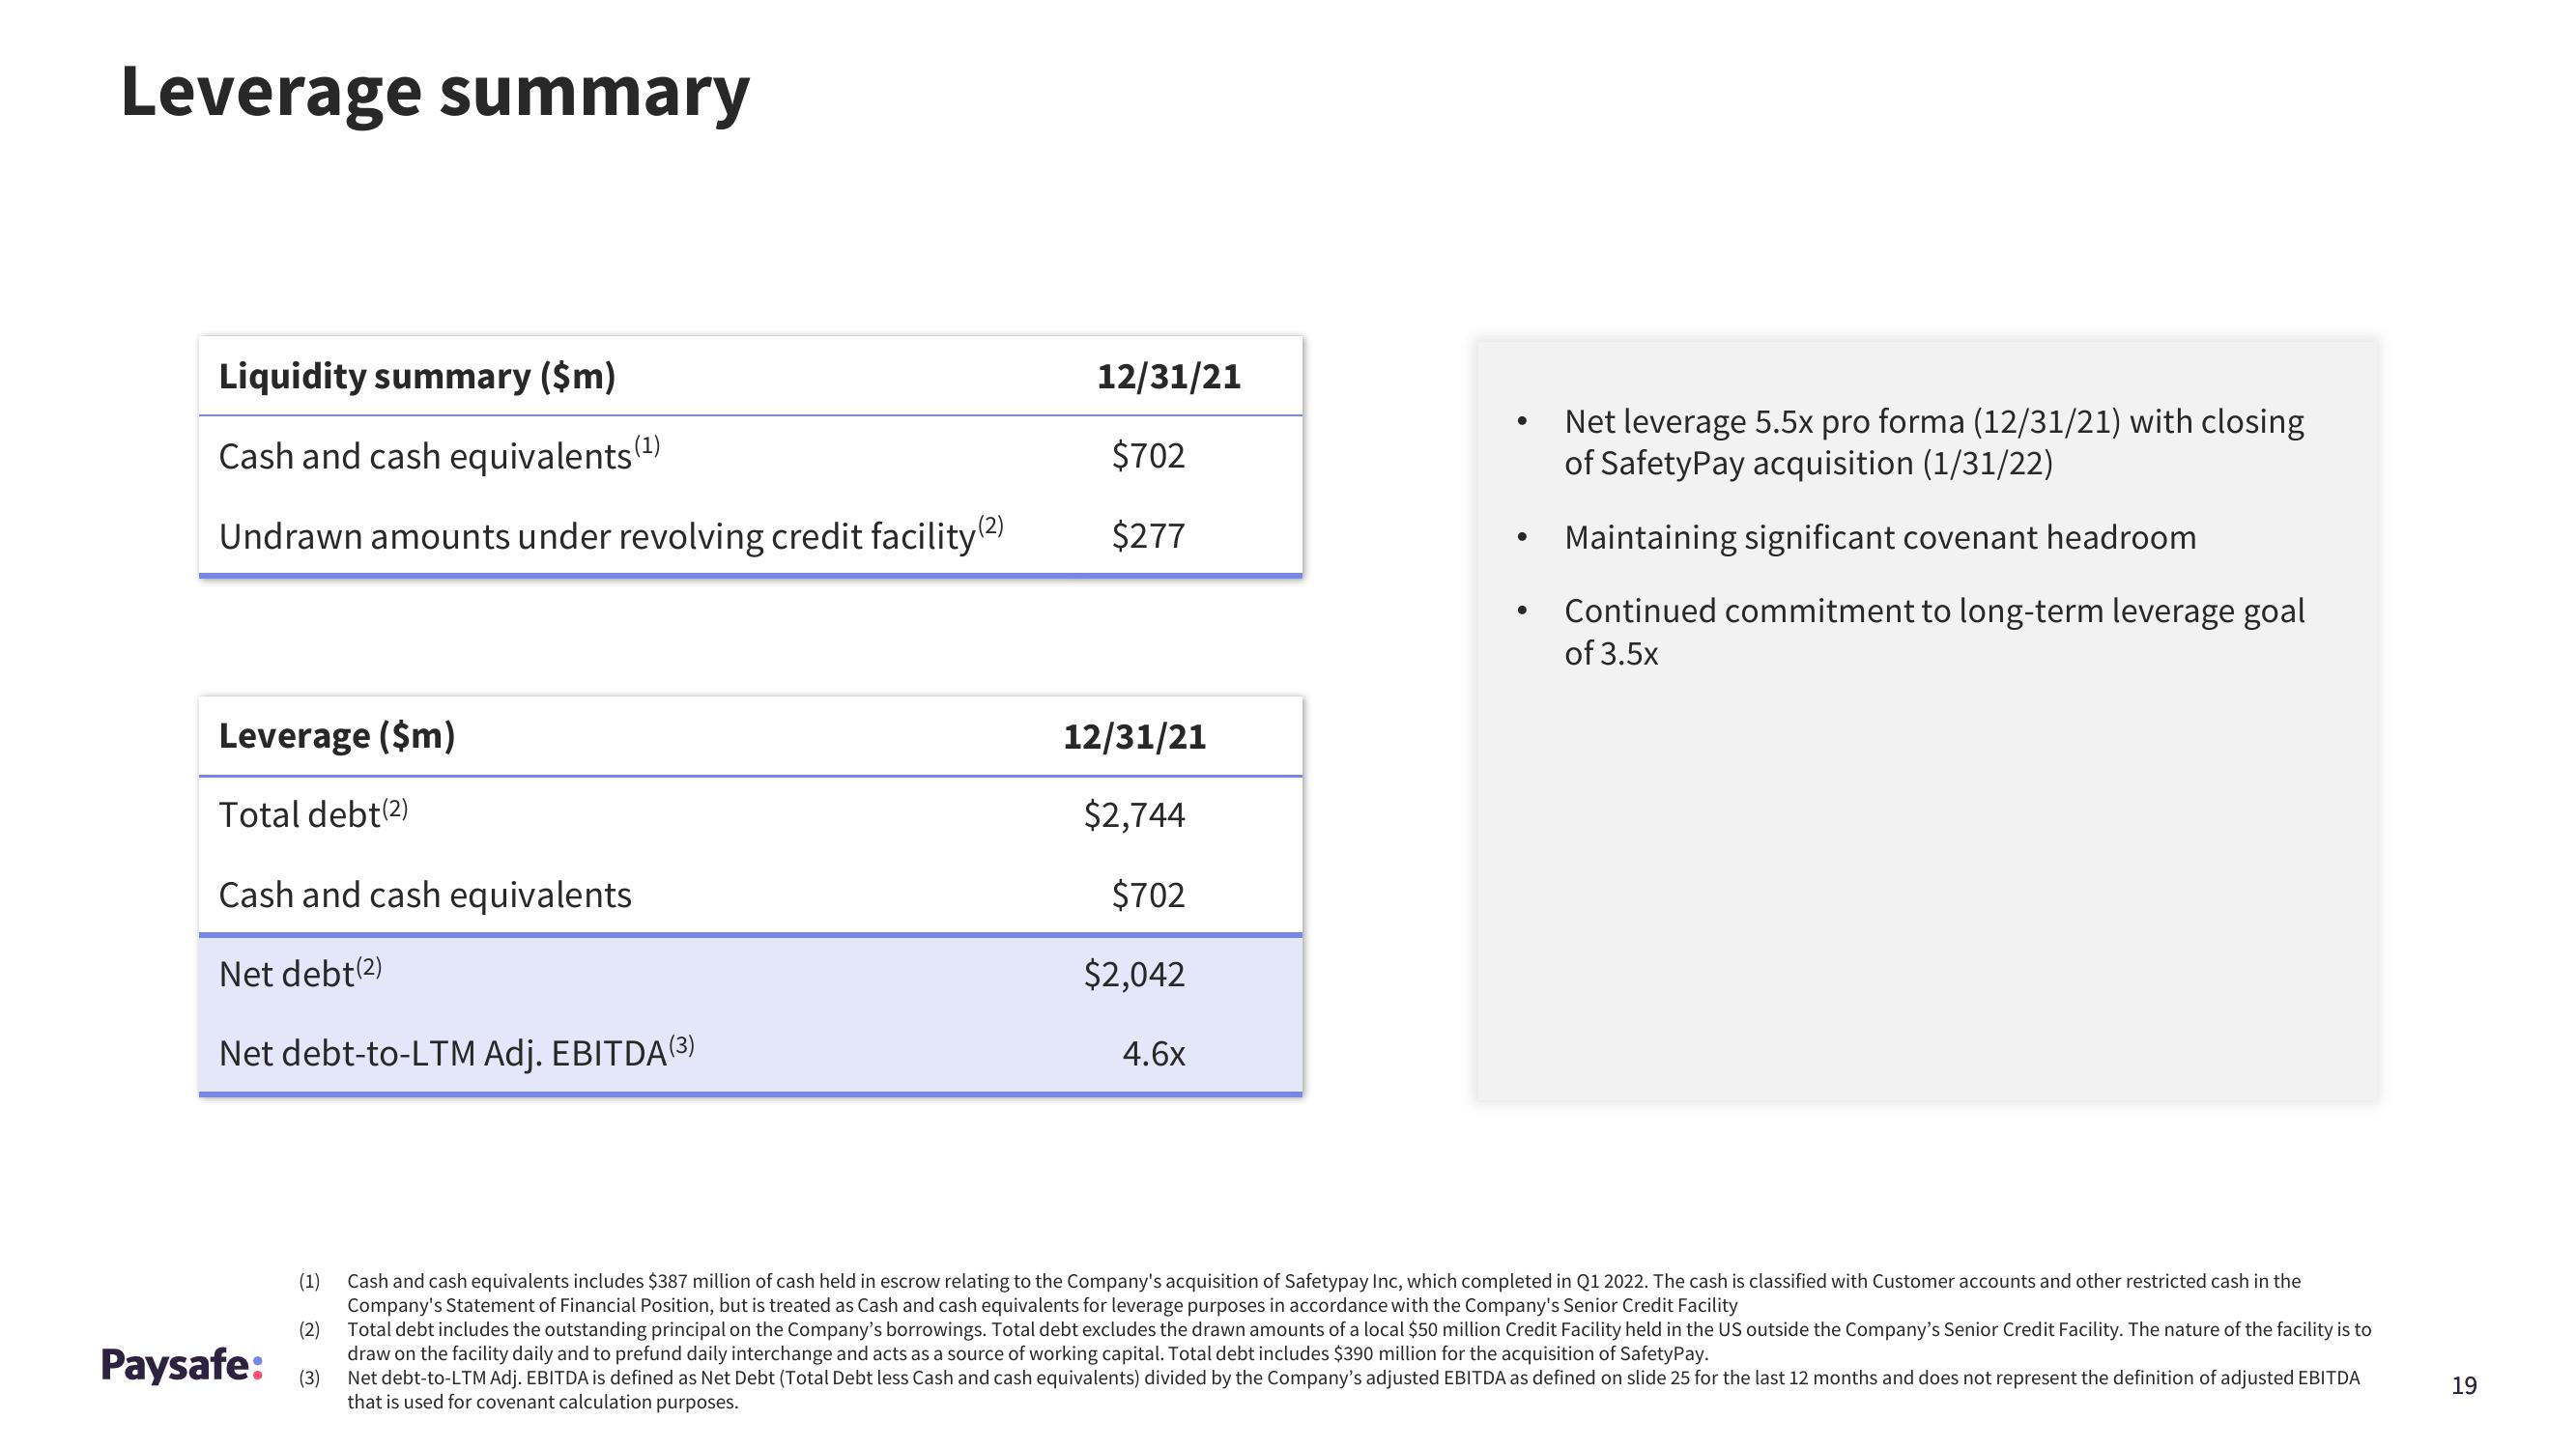
Liquidity summary ($m)
Cash and cash equivalents (¹)
Undrawn amounts under revolving credit facility (2)
Leverage ($m)
Total debt(2)
Cash and cash equivalents
Net debt(2)
Net debt-to-LTM Adj. EBITDA (3)
Paysafe:
(1)
(2)
(3)
12/31/21
$702
$277
12/31/21
$2,744
$702
$2,042
4.6x
●
Net leverage 5.5x pro forma (12/31/21) with closing
of SafetyPay acquisition (1/31/22)
Maintaining significant covenant headroom
Continued commitment to long-term leverage goal
of 3.5x
Cash and cash equivalents includes $387 million of cash held in escrow relating to the Company's acquisition of Safetypay Inc, which completed in Q1 2022. The cash is classified with Customer accounts and other restricted cash in the
Company's Statement of Financial Position, but is treated as Cash and cash equivalents for leverage purposes in accordance with the Company's Senior Credit Facility
Total debt includes the outstanding principal on the Company's borrowings. Total debt excludes the drawn amounts of a local $50 million Credit Facility held in the US outside the Company's Senior Credit Facility. The nature of the facility is to
draw on the facility daily and to prefund daily interchange and acts as a source of working capital. Total debt includes $390 million for the acquisition of SafetyPay.
Net debt-to-LTM Adj. EBITDA is defined as Net Debt (Total Debt less Cash and cash equivalents) divided by the Company's adjusted EBITDA as defined on slide 25 for the last 12 months and does not represent the definition of adjusted EBITDA
that is used for covenant calculation purposes.
19View entire presentation