First Merchants Results Presentation Deck
Non-Interest Expense Highlights
2Q23 Non-Interest Expense Detail
Premises & Equipment
$12.9
14%
$92.6M
Total
Salary & Benefits
$54.8
59%
Other
$7.6
8%
Outside Data Processing
$6.6
7%
Professional & Other Outside Services
$4.7
5%
Intangible Asset Amortization
$2.2
Marketing 3%
$1.1
1%
FDIC Expense
$2.7
3%
Highlights
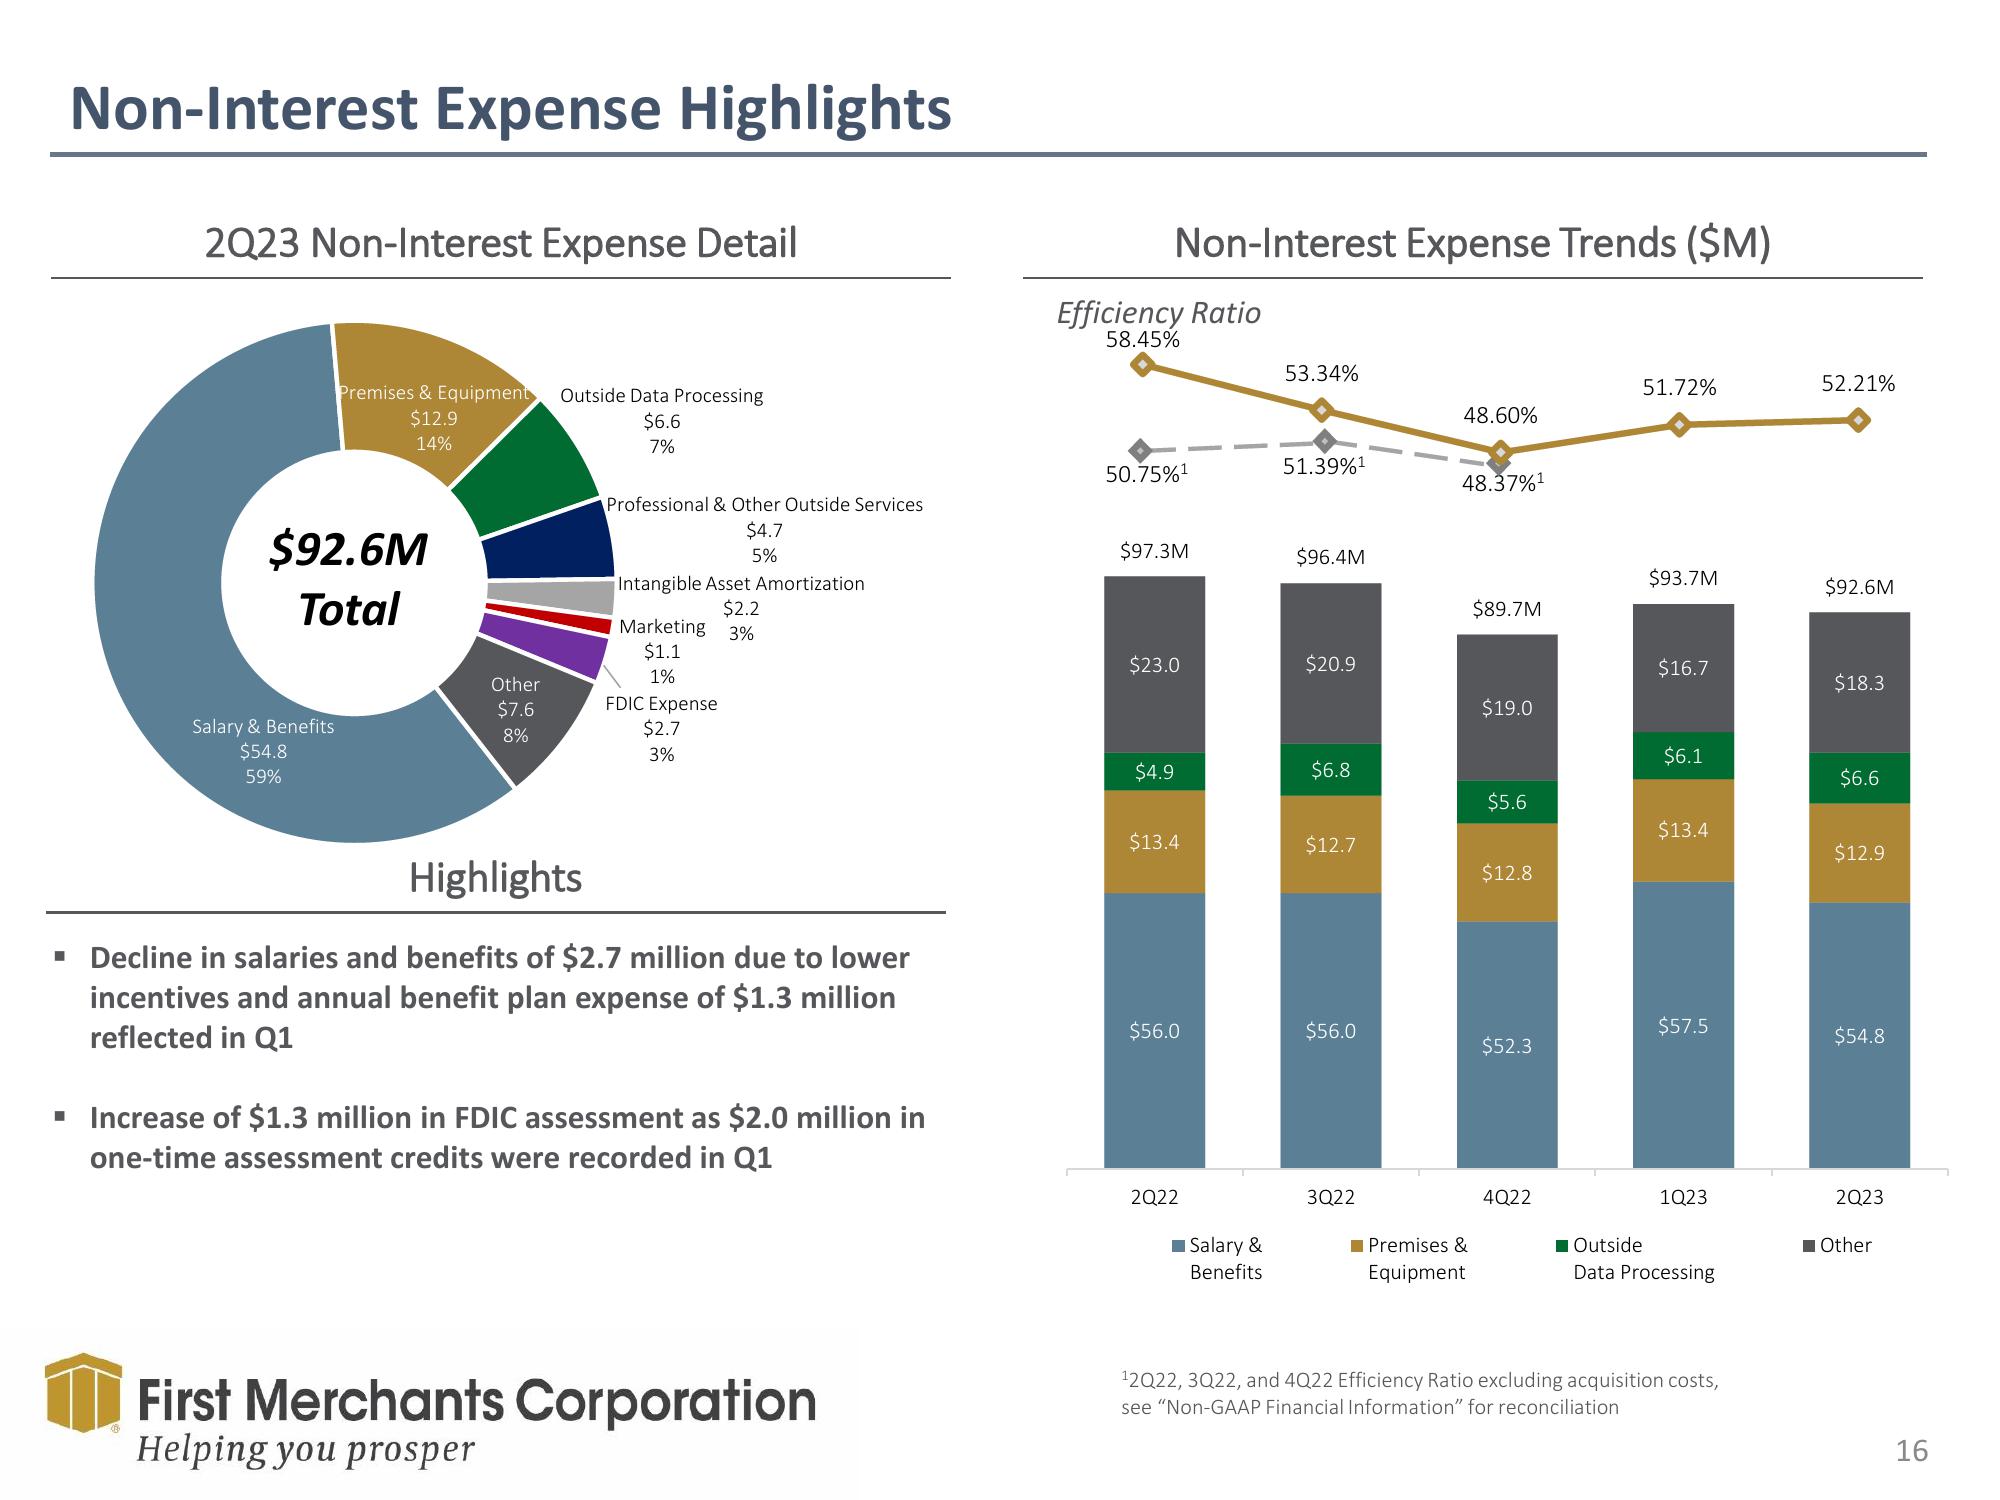
▪ Decline in salaries and benefits of $2.7 million due to lower
incentives and annual benefit plan expense of $1.3 million
reflected in Q1
▪ Increase of $1.3 million in FDIC assessment as $2.0 million in
one-time assessment credits were recorded in Q1
First Merchants Corporation
Helping you prosper
Non-Interest Expense Trends ($M)
Efficiency Ratio
58.45%
50.75% ¹
$97.3M
$23.0
$4.9
$13.4
$56.0
2Q22
■ Salary &
Benefits
53.34%
51.39%¹
$96.4M
$20.9
$6.8
$12.7
$56.0
3Q22
48.60%
48.37%¹
Premises &
Equipment
$89.7M
$19.0
$5.6
$12.8
$52.3
4Q22
51.72%
$93.7M
$16.7
$6.1
$13.4
$57.5
1Q23
Outside
Data Processing
¹2Q22, 3Q22, and 4Q22 Efficiency Ratio excluding acquisition costs,
see "Non-GAAP Financial Information" for reconciliation
52.21%
$92.6M
$18.3
$6.6
$12.9
$54.8
2Q23
Other
16View entire presentation