ANZ 2022 Full Year Results
ANZ 2022 Full Year Results
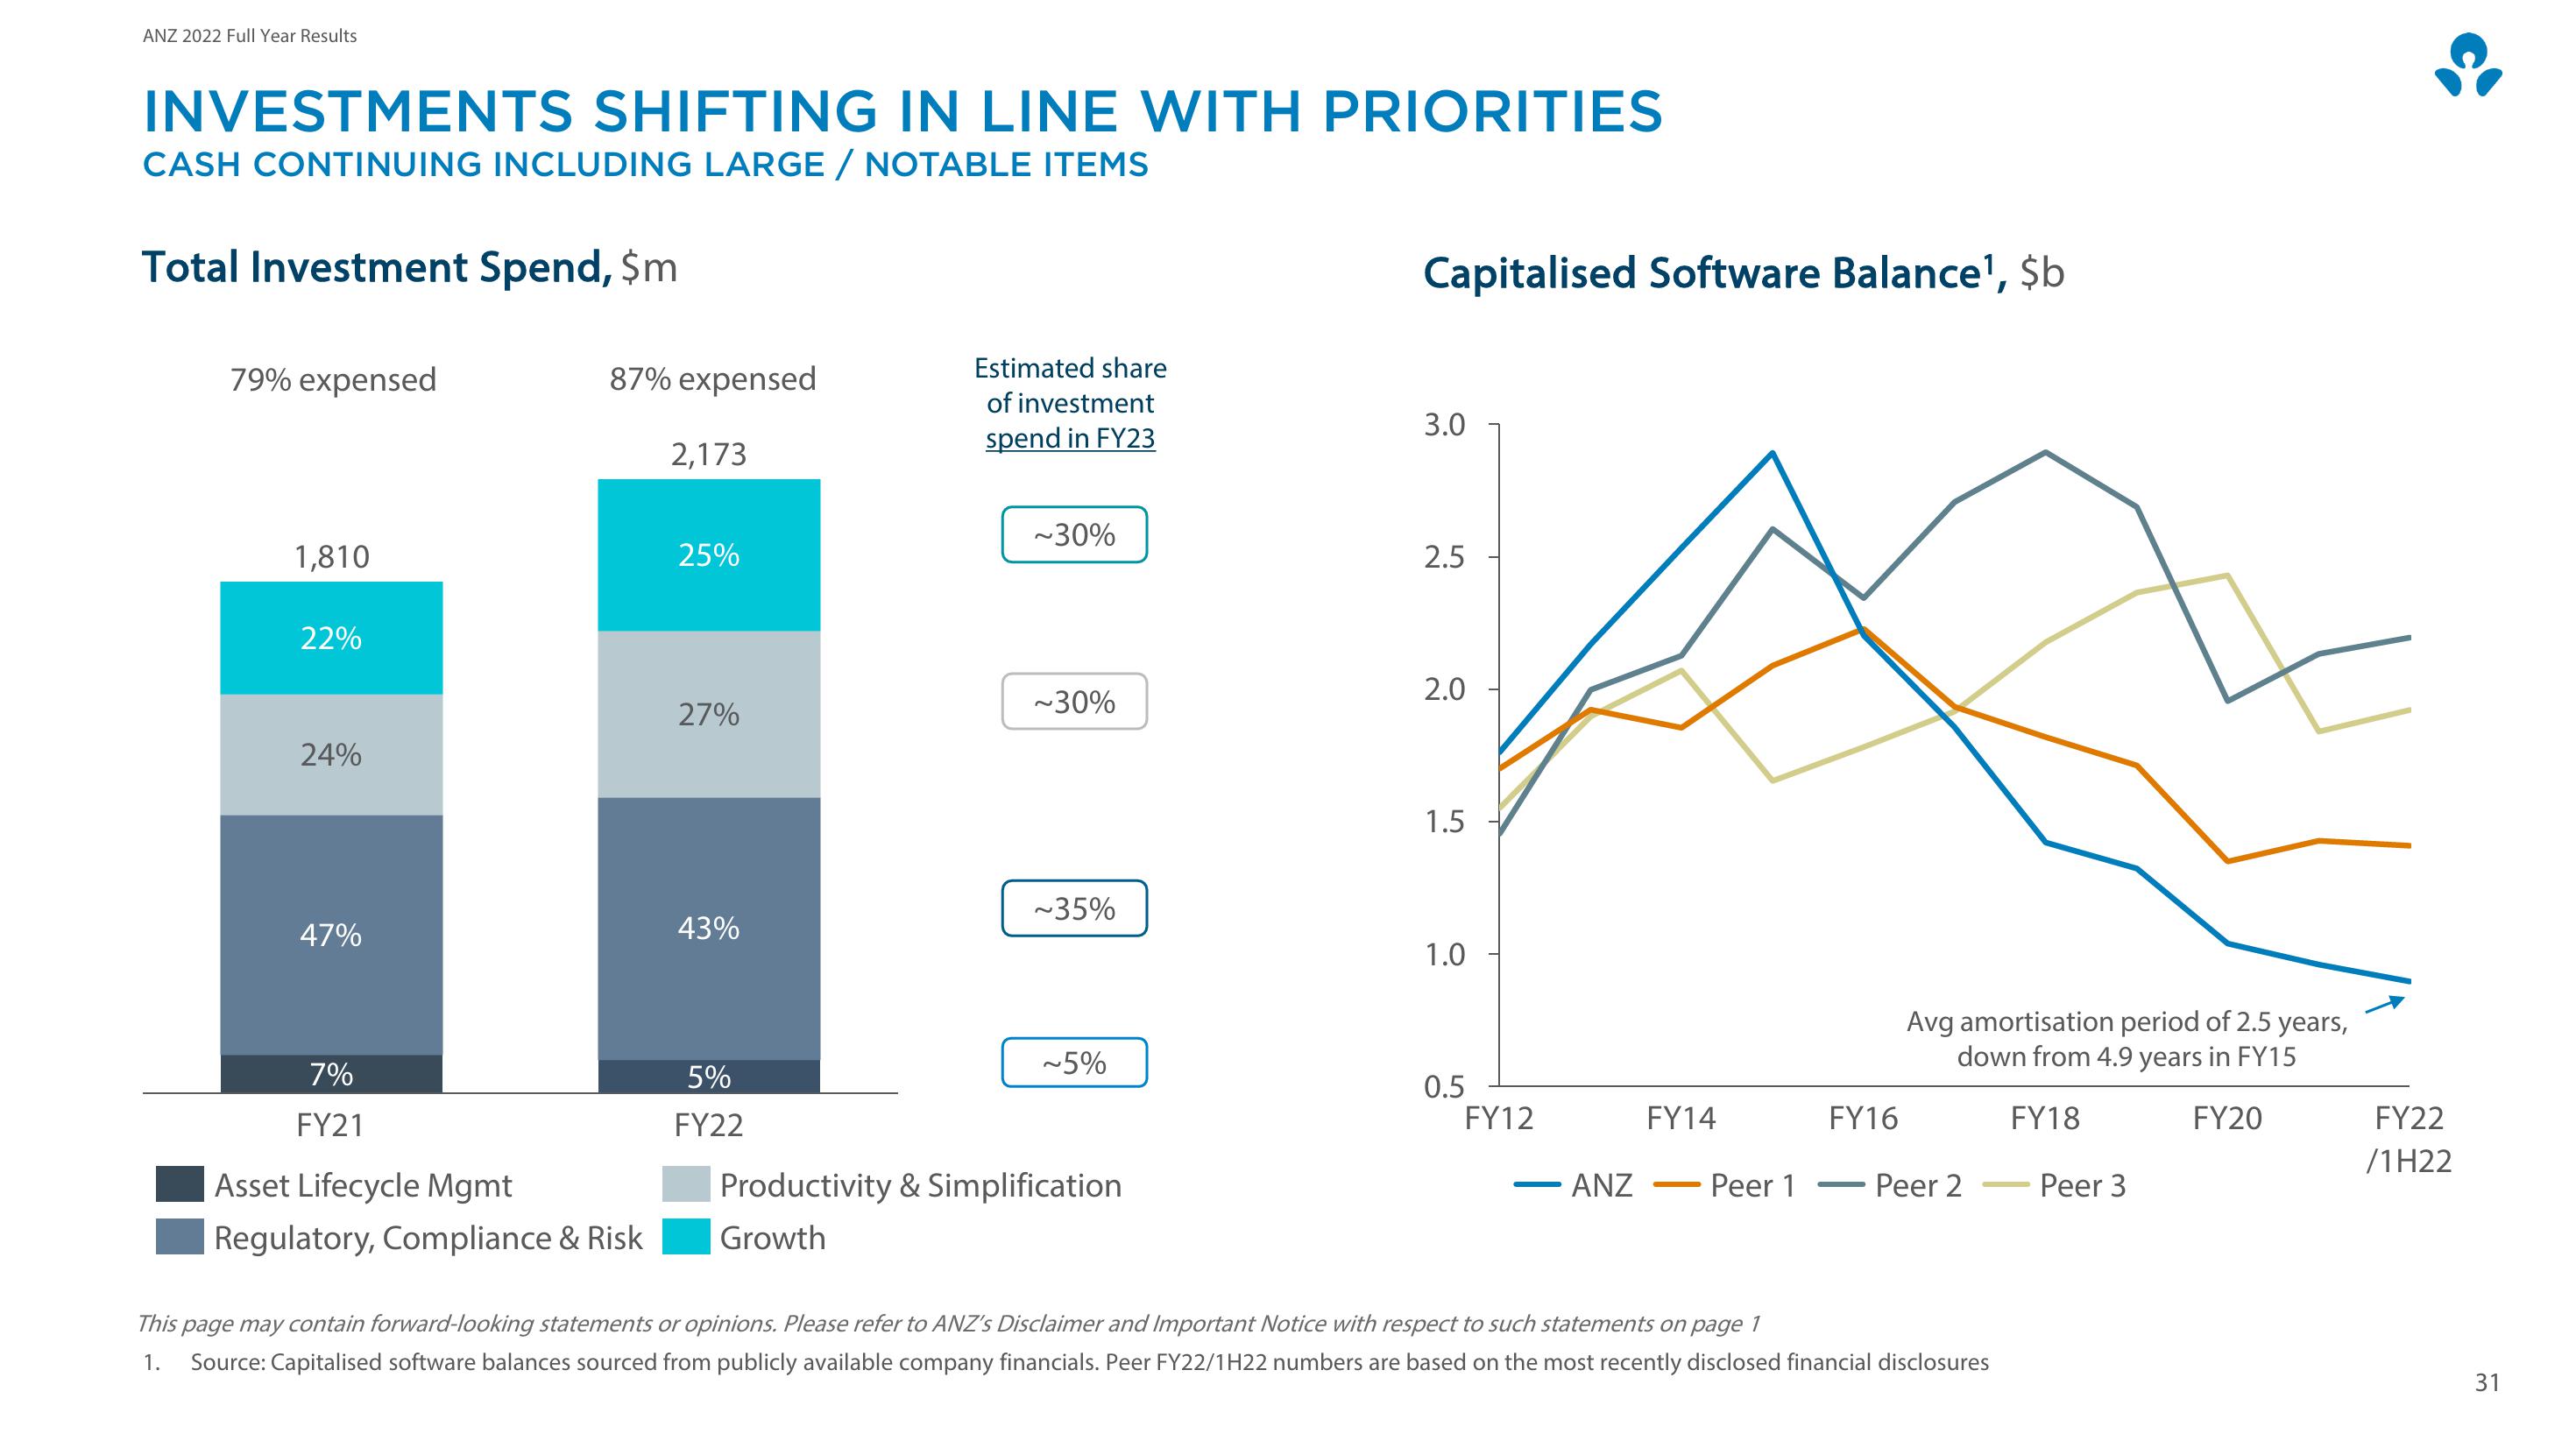
INVESTMENTS SHIFTING IN LINE WITH PRIORITIES
CASH CONTINUING INCLUDING LARGE / NOTABLE ITEMS
Total Investment Spend, $m
Capitalised Software Balance¹, $b
This
1.
79% expensed
87% expensed
Estimated share
of investment
spend in FY23
3.0
2,173
~30%
1,810
25%
2.5
22%
2.0
~30%
27%
24%
1.5
~35%
47%
43%
1.0
~5%
Avg amortisation period of 2.5 years,
down from 4.9 years in FY15
0.5
FY12
FY14
FY16
FY18
FY20
FY22
/1H22
ANZ
Peer 1
Peer 2
Peer 3
7%
FY21
5%
FY22
Asset Lifecycle Mgmt
Productivity & Simplification
Regulatory, Compliance & Risk
Growth
page may contain forward-looking statements or opinions. Please refer to ANZ's Disclaimer and Important Notice with respect to such statements on page 1
Source: Capitalised software balances sourced from publicly available company financials. Peer FY22/1H22 numbers are based on the most recently disclosed financial disclosures
31View entire presentation