KKR Real Estate Finance Trust Investor Presentation Deck
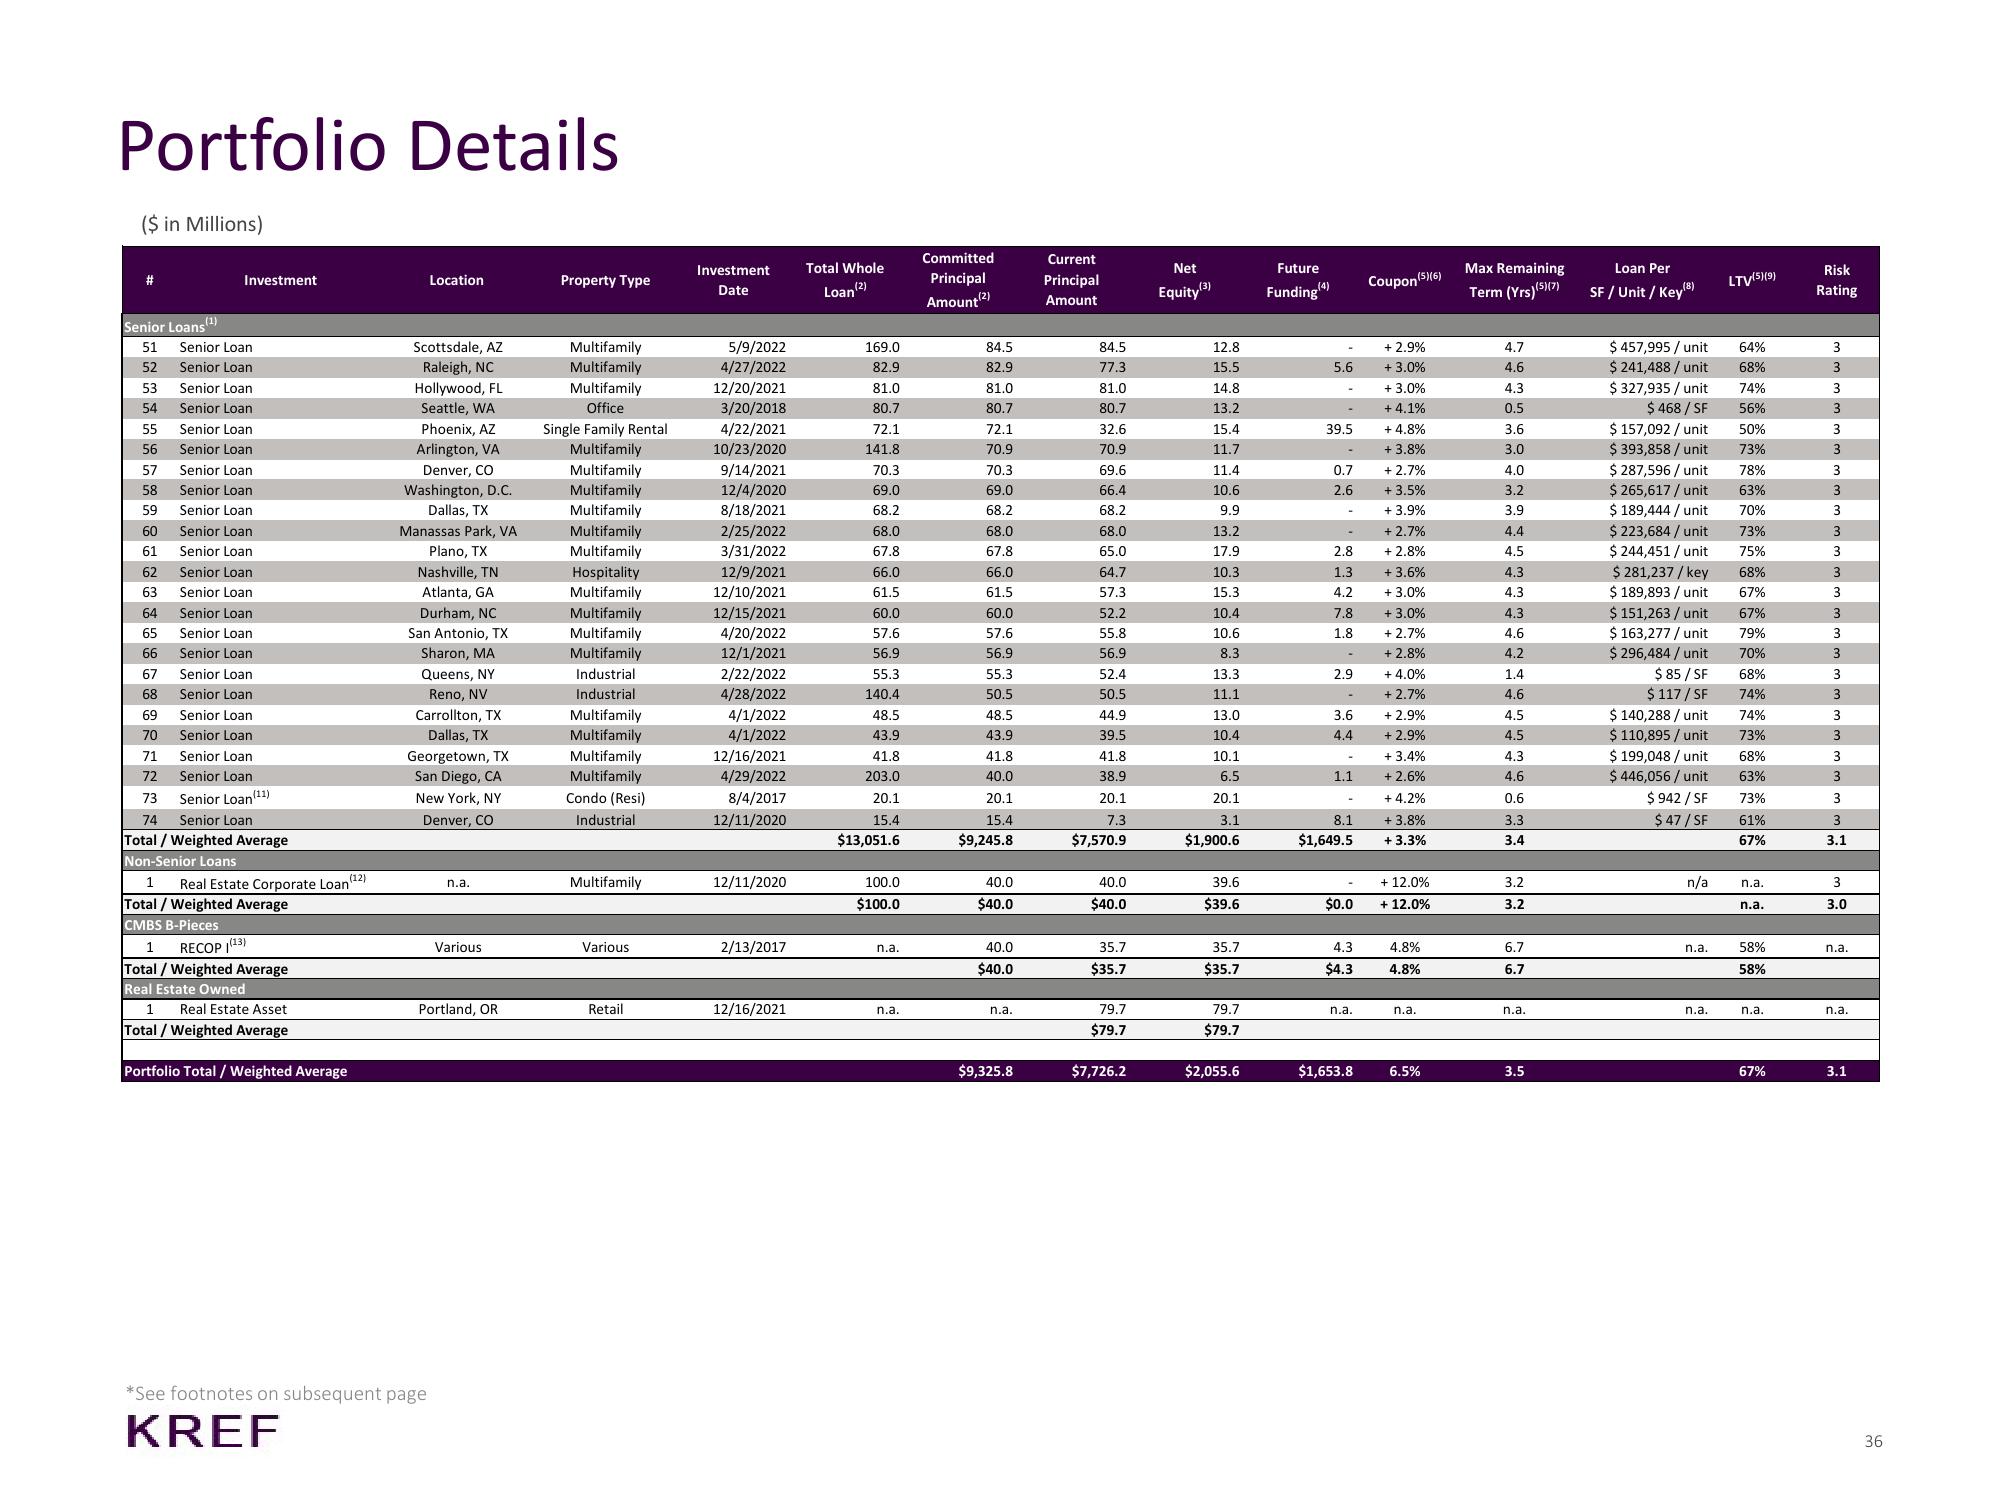
Portfolio Details
($ in Millions)
Senior Loans (¹)
51
52
53
54
55
56
57
58
59
60
61
62
63
64
65
66
67
68
69
70
71
72
Investment
Senior Loan.
Senior Loan
Senior Loan
Senior Loan
Senior Loan
Senior Loan
Senior Loan
Senior Loan
Senior Loan
Senior Loan
Senior Loan
Senior Loan
Senior Loan
Senior Loan
Senior Loan
Senior Loan
Senior Loan
Senior Loan
Senior Loan
Senior Loan
Senior Loan
Senior Loan
Senior Loan (11)
73
74 Senior Loan
Total / Weighted Average
Non-Senior Loans
1 Real Estate Corporate Loan (¹2)
Total / Weighted Average
CMBS B-Pieces
1
RECOP (13)
Total / Weighted Average
Real Estate Owned
1 Real Estate Asset
Total / Weighted Average
Portfolio Total / Weighted Average
Location
Scottsdale, AZ
Raleigh, NC
Hollywood, FL
Seattle, WA
Phoenix, AZ
Arlington, VA
Denver, CO
Washington, D.C.
Dallas, TX
Manassas Park, VA
Plano, TX
Nashville, TN
Atlanta, GA
Durham, NC
San Antonio, TX
Sharon, MA
Queens, NY
Reno, NV
Carrollton, TX
Dallas, TX
Georgetown, TX
San Diego, CA
New York, NY
Denver, CO
*See footnotes on subsequent page
KREF
n.a.
Various
Portland, OR
Property Type
Multifamily
Multifamily
Multifamily
Office
Single Family Rental
Multifamily
Multifamily
Multifamily
Multifamily
Multifamily
Multifamily
Hospitality
Multifamily.
Multifamily
Multifamily
Multifamily
Industrial
Industrial
Multifamily
Multifamily
Multifamily
Multifamily
Condo (Resi)
Industrial
Multifamily
Various
Retail
Investment
Date
5/9/2022
4/27/2022
12/20/2021
3/20/2018
4/22/2021
10/23/2020
9/14/2021
12/4/2020
8/18/2021
2/25/2022
3/31/2022
12/9/2021
12/10/2021
12/15/2021
4/20/2022
12/1/2021
2/22/2022
4/28/2022
4/1/2022
4/1/2022
12/16/2021
4/29/2022
8/4/2017
12/11/2020
12/11/2020
2/13/2017
12/16/2021
Total Whole
Loan (2)
169.0
82.9
81.0
80.7
72.1
141.8
70.3
69.0
68.2
68.0
67.8
66.0
61.5
60.0
57.6
56.9
55.3
140.4
48.5
43.9
41.8
203.0
20.1
15.4
$13,051.6
100.0
$100.0
n.a.
n.a.
Committed
Principal
Amount (2)
84.5
82.9
81.0
80.7
72.1
70.9
70.3
69.0
68.2
68.0
67.8
66.0
61.5
60.0
57.6
56.9
55.3
50.5
48.5
43.9
41.8
40.0
20.1
15.4
$9,245.8
40.0
$40.0
40.0
$40.0
n.a.
$9,325.8
Current
Principal
Amount
84.5
77.3
81.0
80.7
32.6
70.9
69.6
66.4
68.2
68.0
65.0
64.7
57.3
52.2
55.8
56.9
52.4
50.5
44.9
39.5
41.8
38.9
20.1
7.3
$7,570.9
40.0
$40.0
35.7
$35.7
79.7
$79.7
$7,726.2
Net
Equity (3)
12.8
15.5
14.8
13.2
15.4
11.7
11.4
10.6
9.9
13.2
17.9
10.3
15.3
10.4
10.6
8.3
13.3
11.1
13.0
10.4
10.1
6.5
20.1
3.1
$1,900.6
39.6
$39.6
35.7
$35.7
79.7
$79.7
$2,055.6
Future
Funding(4)
-
5.6
39.5
0.7
2.6
2.8
1.3
4.2
7.8
1.8
2.9
-
3.6
4.4
1.1
8.1
$1,649.5
$0.0
4.3
$4.3
n.a.
$1,653.8
Coupon (5)(6)
+ 2.9%
+ 3.0%
+ 3.0%
+ 4.1%
+ 4.8%
+ 3.8%
+ 2.7%
+ 3.5%
+ 3.9%
+2.7%
+ 2.8%
+
3.6%
+ 3.0%
+ 3.0%
+ 2.7%
+ 2.8%
+ 4.0%
+ 2.7%
+ 2.9%
+ 2.9%
+ 3.4%
+ 2.6%
+ 4.2%
+ 3.8%
+ 3.3%
+ 12.0%
+ 12.0%
4.8%
4.8%
n.a.
6.5%
Max Remaining
Term (Yrs) (5) (7)
4.7
4.6
4.3
0.5
3.6
3.0
4.0
3.2
3.9
4.4
4.5
4.3
4.3
4.3
4.6
4.2
1.4
4.6
4.5
4.5
4.3
4.6
0.6
3.3
3.4
3.2
3.2
6.7
6.7
n.a.
3.5
Loan Per
SF / Unit / Key(8)
$ 457,995 / unit
$ 241,488 / unit
$327,935 / unit
$ 468/SF
$ 157,092 / unit
$ 393,858 / unit
$ 287,596 / unit
$ 265,617 / unit
$ 189,444 / unit
$223,684 / unit
$ 244,451 / unit
$ 281,237/key
$ 189,893/unit
$ 151,263/unit
$ 163,277 / unit
$ 296,484 / unit
$ 85/SF
$ 117/SF
$ 140,288 / unit
$ 110,895/ unit
$ 199,048 / unit
$ 446,056 / unit
$942/SF
$ 47/SF
n/a
n.a.
n.a.
LTV(5)(9)
64%
68%
74%
56%
50%
73%
78%
63%
70%
73%
75%
68%
67%
67%
79%
70%
68%
74%
74%
73%
68%
63%
73%
61%
67%
n.a.
n.a.
58%
58%
n.a.
67%
Risk
Rating
3
3
3
3
3
3
3
3
3
3
3
3
3
3
3
3
3
3
3
3
3
3
3
3
3.1
3
3.0
n.a.
n.a.
3.1
36View entire presentation