Alcon Q1 2023 Earnings Presentation
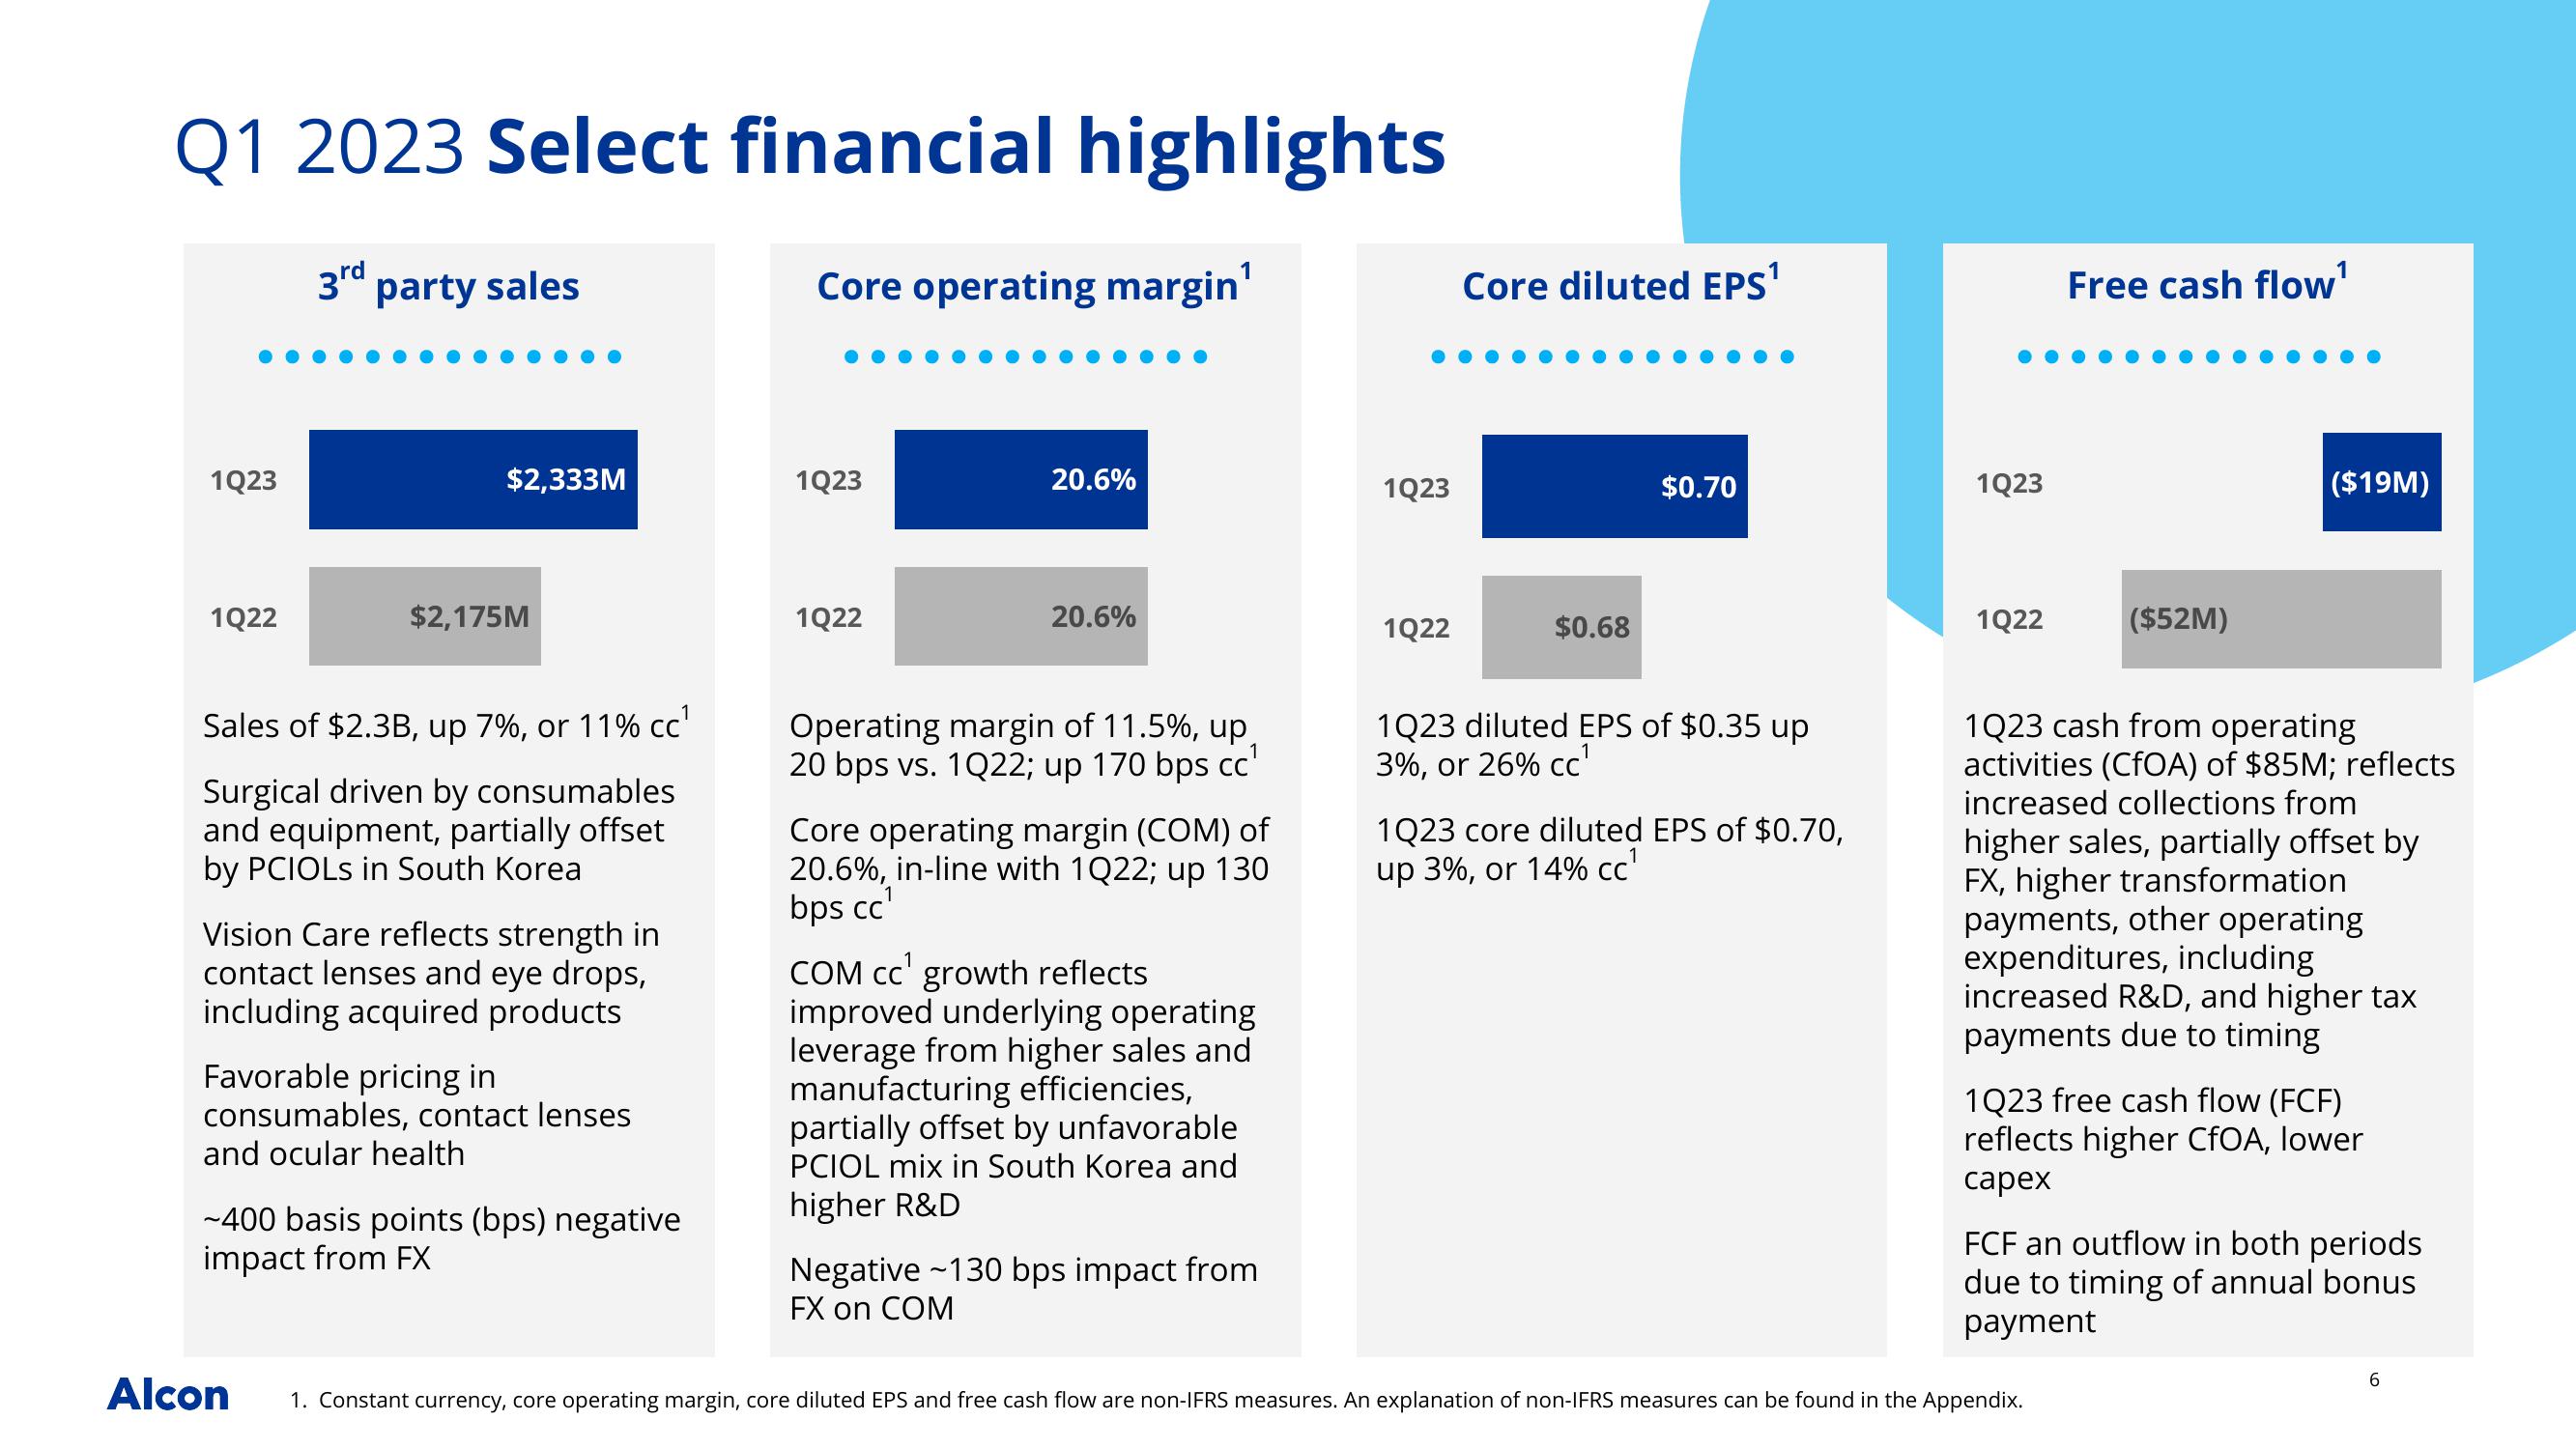
Q1 2023 Select financial highlights
Core operating margin'
1Q23
1Q22
3rd
party sales
$2,333M
$2,175M
Sales of $2.3B, up 7%, or 11% cc¹
Surgical driven by consumables
and equipment, partially offset
by PCIOLS in South Korea
Alcon
Vision Care reflects strength in
contact lenses and eye drops,
including acquired products
Favorable pricing in
consumables, contact lenses
and ocular health
~400 basis points (bps) negative
impact from FX
1Q23
1Q22
20.6%
20.6%
Operating margin of 11.5%, up
20 bps vs. 1Q22; up 170 bps cc¹
Core operating margin (COM) of
20.6%, in-line with 1Q22; up 130
bps cc¹
COM cc growth reflects
improved underlying operating
leverage from higher sales and
manufacturing efficiencies,
partially offset by unfavorable
PCIOL mix in South Korea and
higher R&D
Negative -130 bps impact from
FX on COM
1Q23
1Q22
Core diluted EPS¹
$0.68
$0.70
1Q23 diluted EPS of $0.35 up
3%, or 26% cc¹
1Q23 core diluted EPS of $0.70,
up 3%, or 14% cc¹
1Q23
1Q22
Free cash flow¹
($52M)
($19M)
1Q23 cash from operating
activities (CfOA) of $85M; reflects
increased collections from
higher sales, tially offset by
FX, higher transformation
payments, other operating
expenditures, including
increased R&D, and higher tax
payments due to timing
1. Constant currency, core operating margin, core diluted EPS and free cash flow are non-IFRS measures. An explanation of non-IFRS measures can be found in the Appendix.
1Q23 free cash flow (FCF)
reflects higher CfOA, lower
capex
FCF an outflow in both periods
due to timing of annual bonus
payment
6View entire presentation