Analyst Day Presentation
60
61
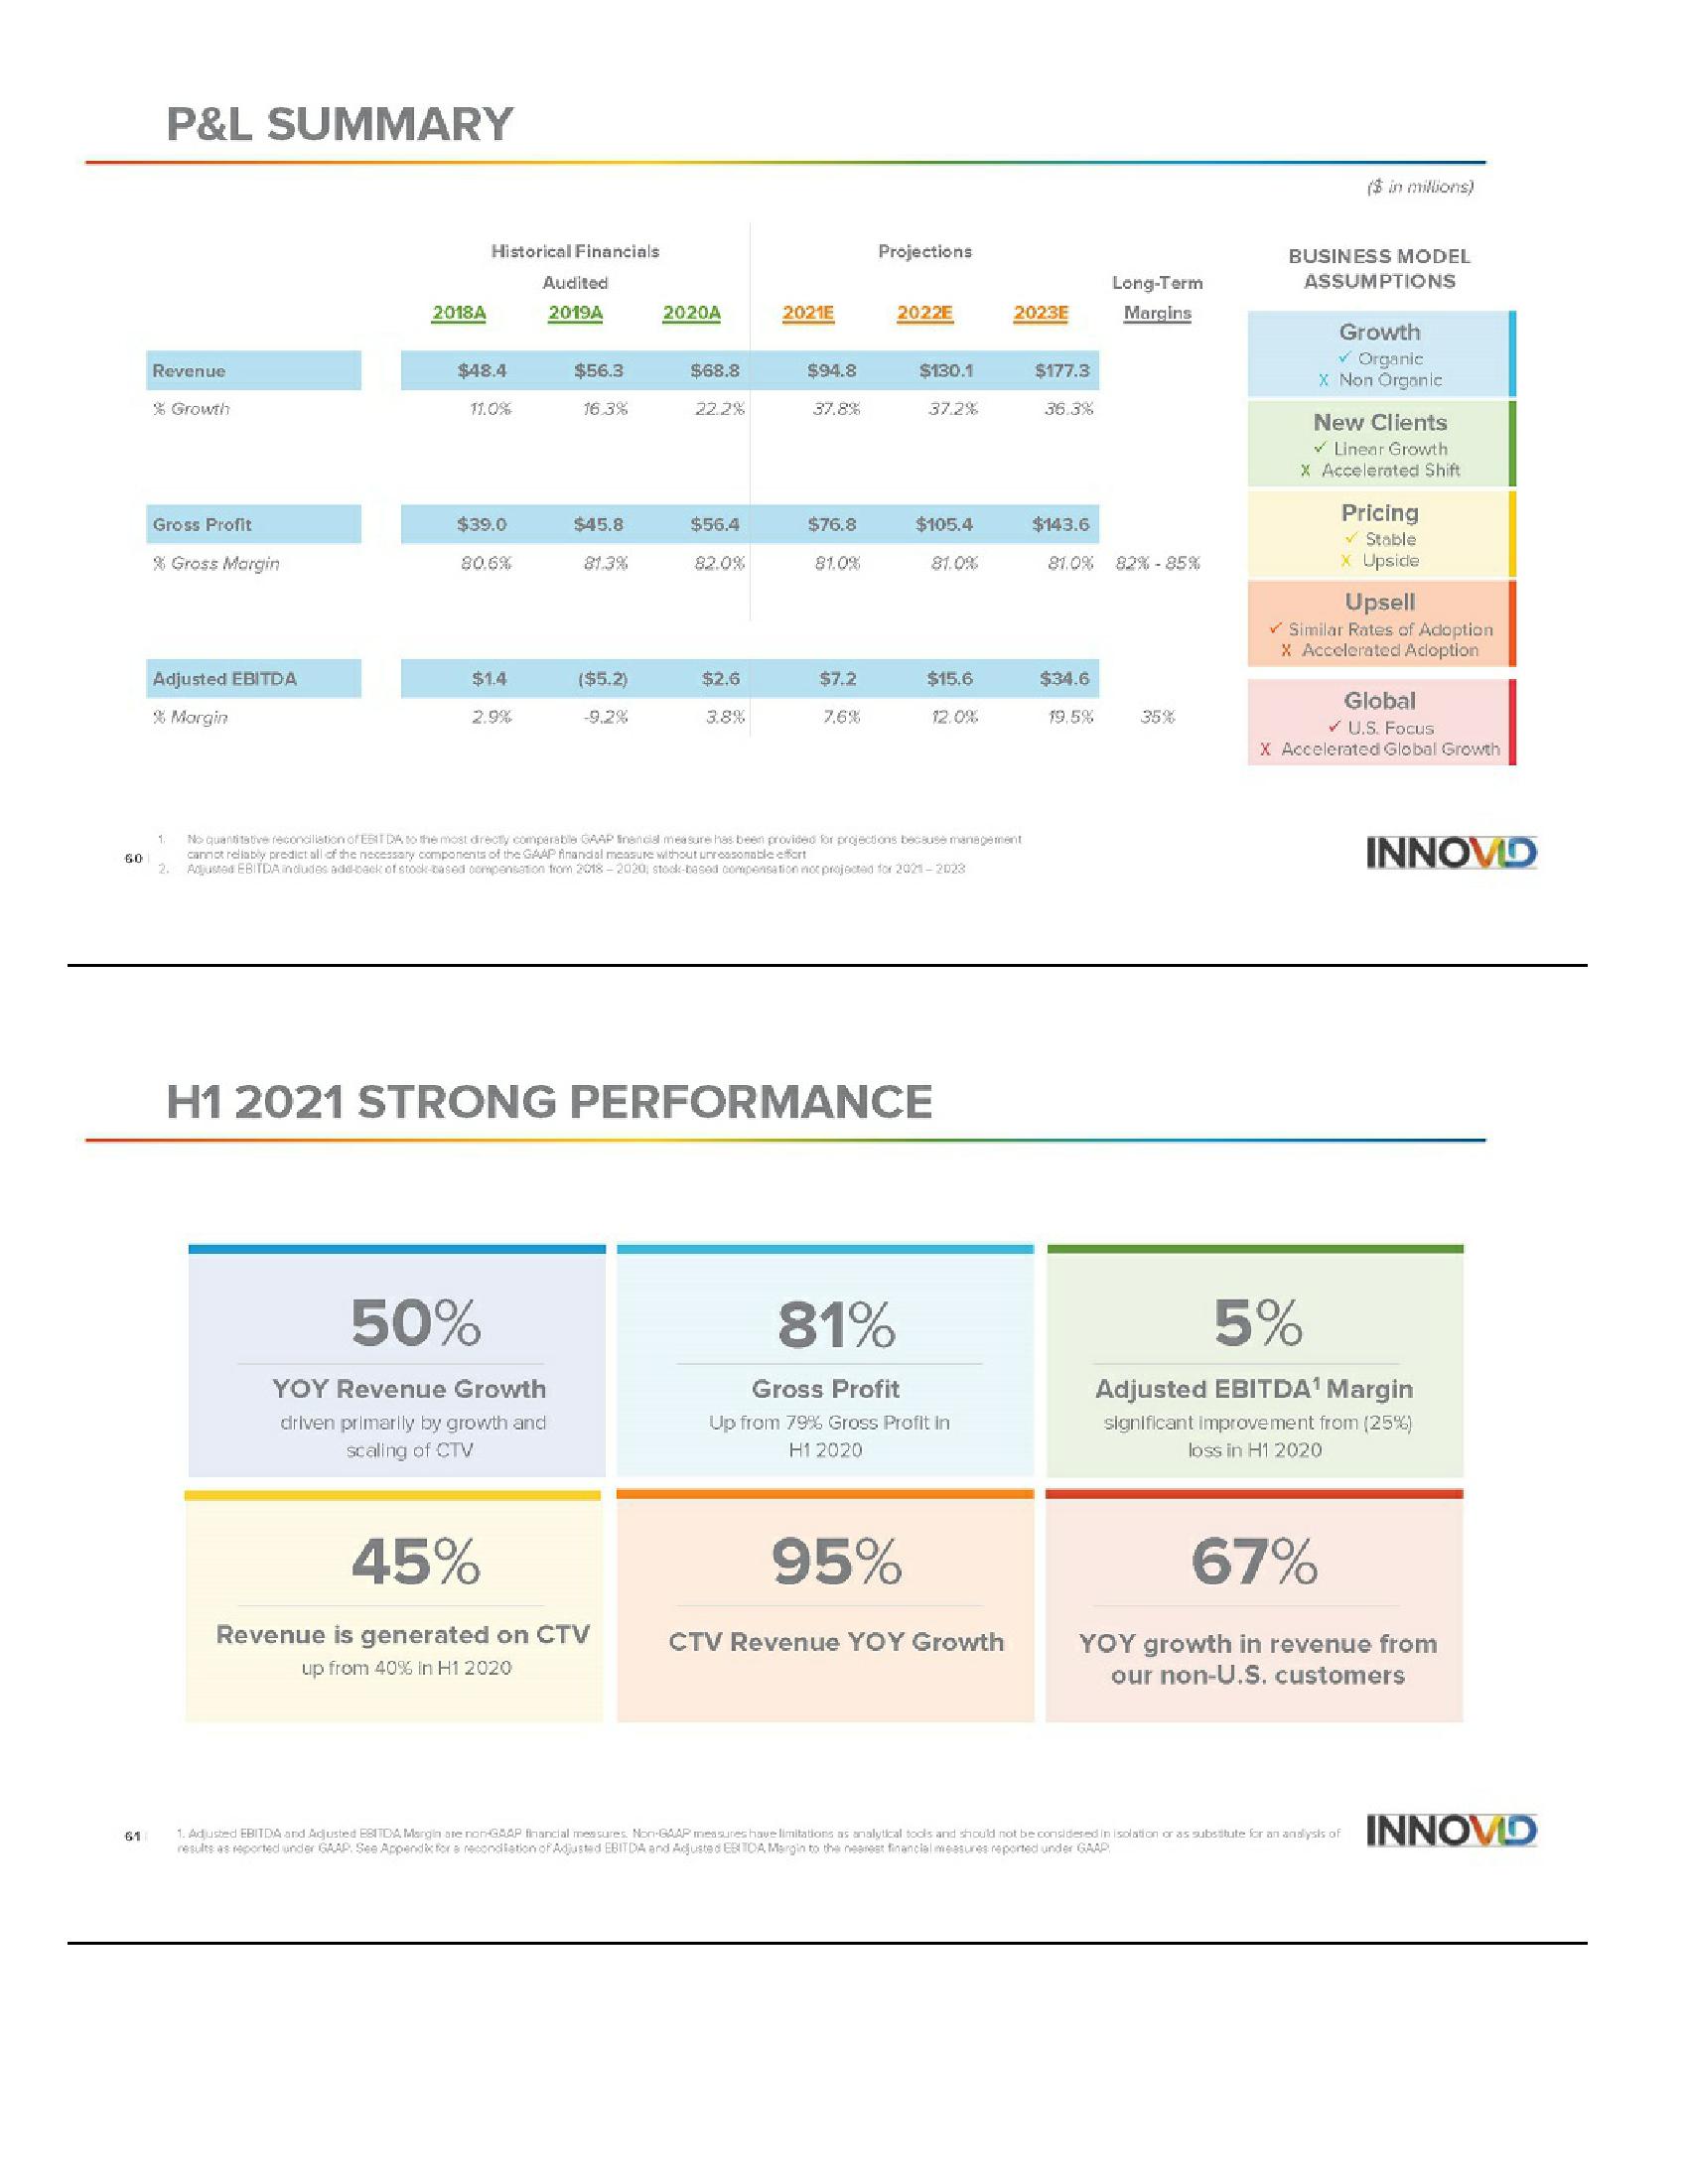
P&L SUMMARY
Revenue
% Growth
Gross Profit
% Gross Margin
Adjusted EBITDA
% Margin
1.
2.
2018A
Historical Financials
$48.4
11.0%
$39.0
$1.4
2.9%
Audited
2019A
$56.3
16.3%
50%
YOY Revenue Growth
driven primarily by growth and
scaling of CTV
$45.8
81.3%
($5.2)
-9,2%
2020A
$68.8
45%
Revenue is generated on CTV
up from 40% in H1 2020
22.2%
$56.4
82.0%
$2.6
3.8%
2021E
$94.8
37.8%
$76.8
81.0%
$7.2
7,6%
Projections
2022E
81%
$130.1
37.2%
95%
$105.4
81.0%
No quantitative reconciliation of EBITDA to the most directly comparable GAAP financial measure has been provided for projections because management
cannot reliably predict all of the necessary components of the GAAP finandal measure without unreasonable effort
Adjusted EBITDA indudes add-back of stock-based compensation from 2018-2020, stock-based compensation not projected for 2021-2023
H1 2021 STRONG PERFORMANCE
$15.6
12.0%
Gross Profit
Up from 79% Gross Profit in
H12020
2023E
CTV Revenue YOY Growth
$177.3
36.3%
$143.6
81.0% 82% -85%
$34.6
Long-Term
Margins
19,5%
($ in millions)
BUSINESS MODEL
ASSUMPTIONS
Growth
✓ Organic
X Non Organic
New Clients
✓ Linear Growth
X Accelerated Shift
Pricing
✓ Stable
x Upside
Upsell
✓Similar Rates of Adoption
X Accelerated Adoption
Global
U.S. Focus
X Accelerated Global Growth
INNOVID
5%
Adjusted EBITDA¹ Margin
significant improvement from (25%)
loss in H1 2020
67%
YOY growth in revenue from
our non-U.S. customers
1. Adjusted EBITDA and Adjusted EBITDA Margin are non-GAAP financial measures. Non-GAAP measures have limitations as analytical tools and should not be considered in isolation or as substitute for an analysis of INNOVD
results as reported under GAAP See Appendic for a recondliation of Adjusted EBITDA and Adjusted EBITOA Margin to the nearest financial measures reported under GAAPView entire presentation