Amplitude Results Presentation Deck
(8
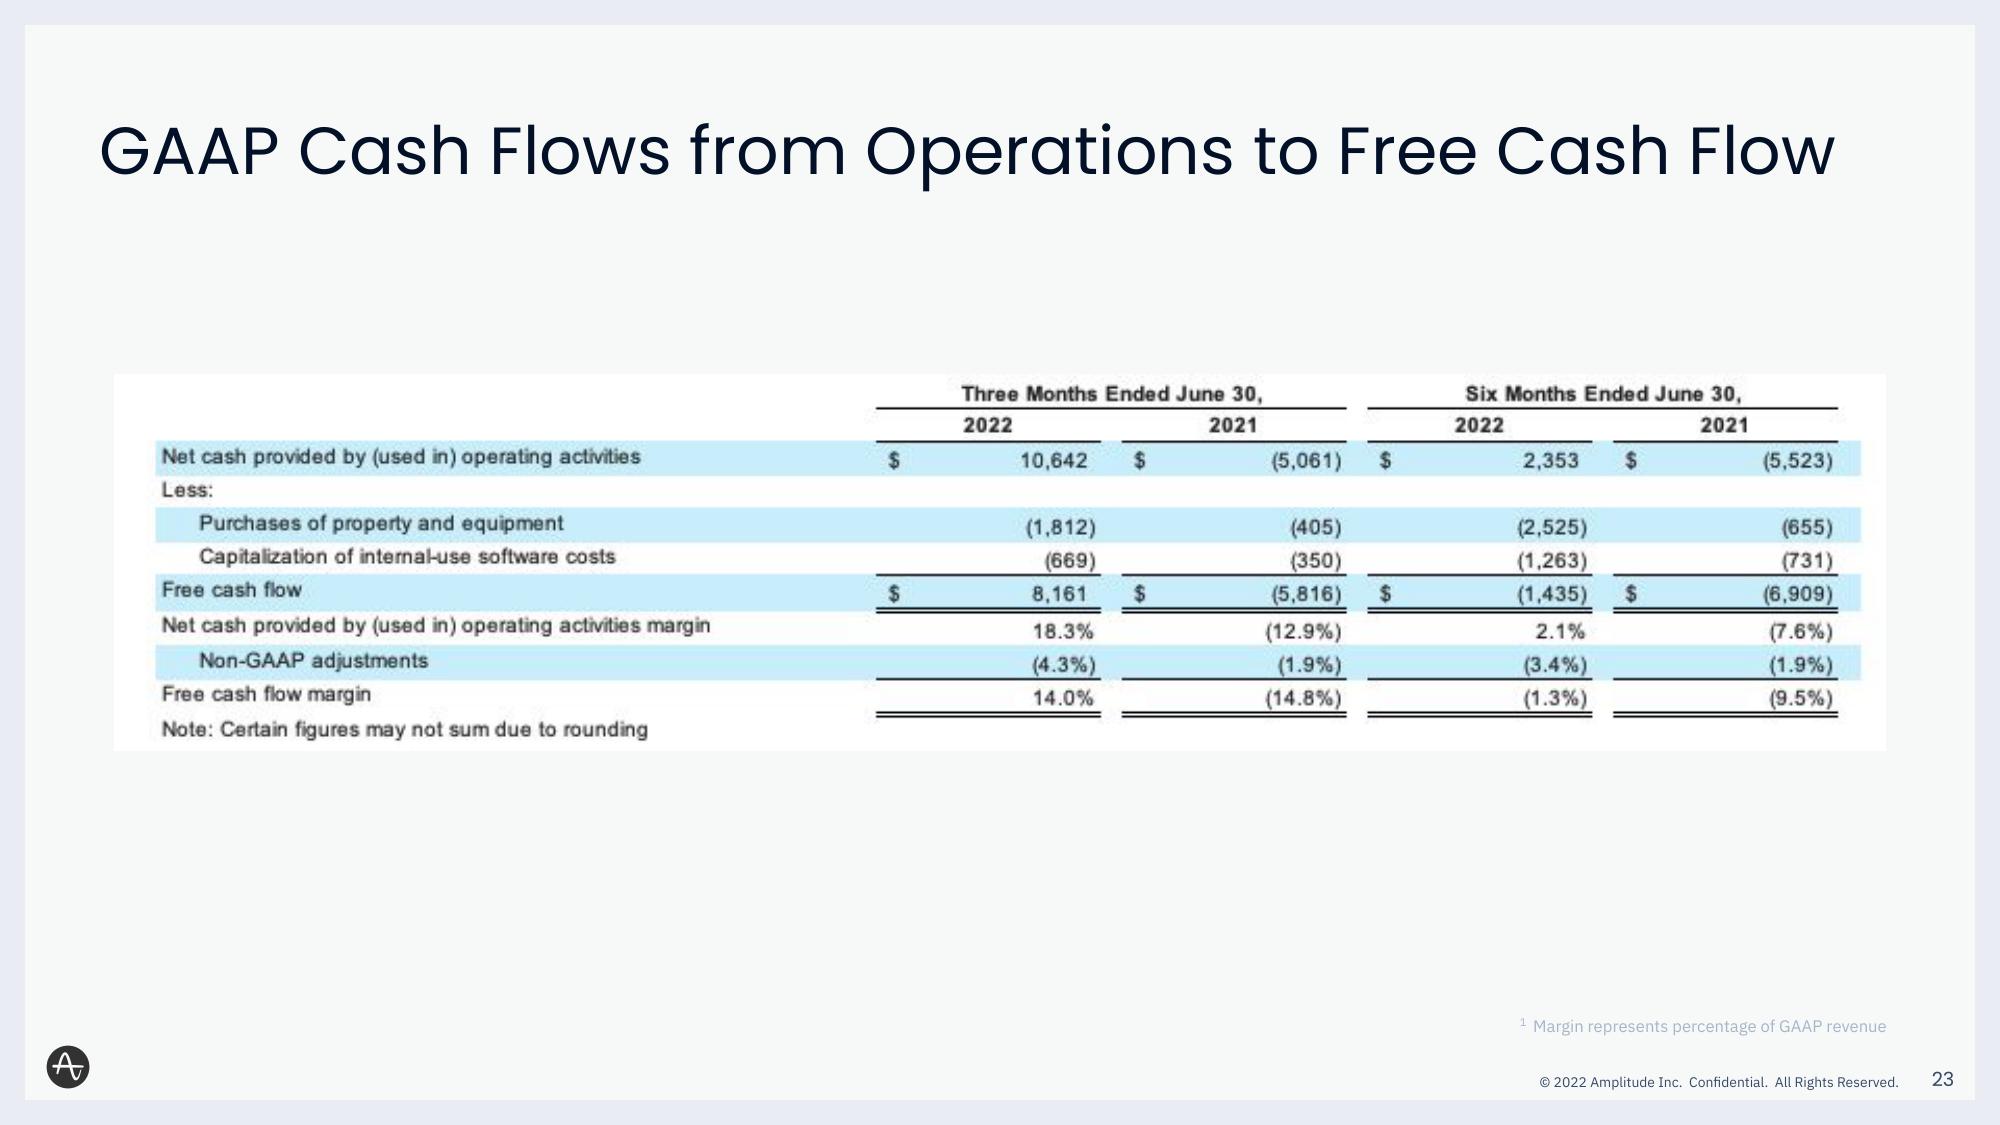
GAAP Cash Flows from Operations to Free Cash Flow
Net cash provided by (used in) operating activities
Less:
Purchases of property and equipment
Capitalization of internal-use software costs
Free cash flow
Net cash provided by (used in) operating activities margin
Non-GAAP adjustments
Free cash flow margin
Note: Certain figures may not sum due to rounding
$
$
Three Months Ended June 30,
2022
2021
10,642 $
(1,812)
(669)
8,161
18.3%
(4.3%)
14.0%
$
(5,061) $
(405)
(350)
(5,816)
(12.9%)
(1.9%)
(14.8%)
$
Six Months Ended June 30,
2022
2021
2,353
(2,525)
(1,263)
(1,435)
2.1%
(3.4%)
(1.3%)
$
$
(5,523)
(655)
(731)
(6,909)
(7.6%)
(1.9%)
(9.5%)
¹ Margin represents percentage of GAAP revenue
© 2022 Amplitude Inc. Confidential. All Rights Reserved.
23View entire presentation