HashiCorp Investor Day Presentation Deck
42
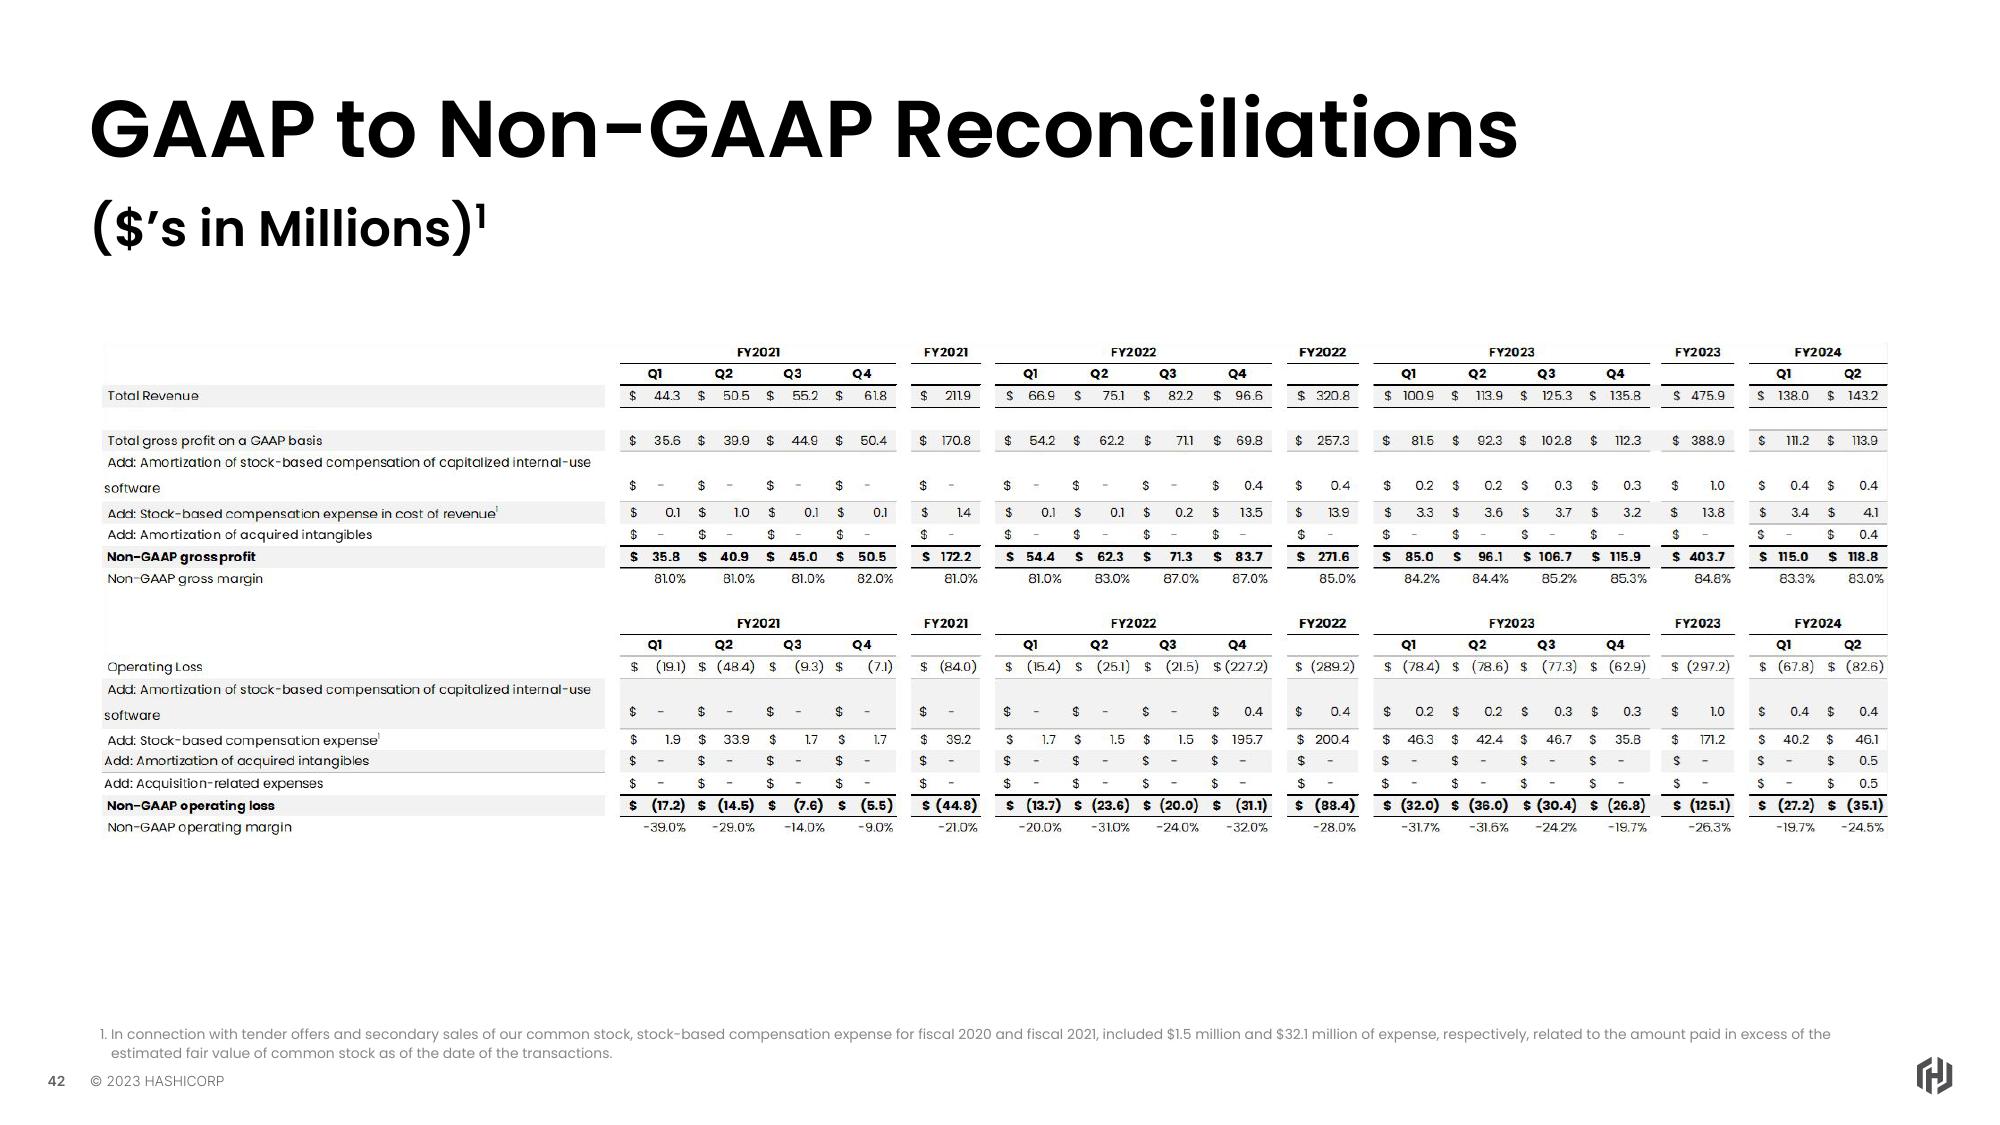
GAAP to Non-GAAP Reconciliations
($'s in Millions)¹
Total Revenue
Total gross profit on a GAAP basis
Add: Amortizatio
software
k-based compensation of apitalized internal-use
Add: Stock-based compensation expense in cost of revenue
Add: Amortization of acquired intangibles
Non-GAAP gross profit
Non-GAAP gross margin
Operating Loss
Add: Amortization of stock-based compensation of capitalized internal-use
software
Add: Stock-based compensation expense
Add: Amortization of acquired intangibles
Add: Acquisition-related expenses
Non-GAAP operating loss
Non-GAAP operating margin
$
$
$
Q1
$
44.3 $
$
$
$ 35.8
$
$
$
35.6
0.1 $
$
$
81.0%
$
$
1.9
$
FY2021
$
Q2
Q3
50.5 $ 55.2 $
39.9
1.0
40.9
81.0%
$
FY2021
33.9
$
$
$ 45.0
81.0%
Q1
Q2
Q3
$ (19.1) $ (484) $ (9.3) $
44.9
$
$
0.1
-
$
1.7
$
$
$
$
Q4
$
$ 50.5
82.0%
$
61.8
50.4
0.1
Q4
(7.1)
1.7
$
$
$ -
$
$
$(17.2) $ (14.5) $ (7.6) $ (5.5)
-39.0% -29.0% -14.0%
-9.0%
FY2021
$ 211.9
$170.8
$
$
S 172.2
81.0%
FY2021
1.4
$ (84.0)
$
$
$
$
$ (44.8)
-21.0%
39.2
-
Q1
$ 66.9
$ 54.2
$
$ 0.1
$
S 54.4
81.0%
$
S
-
$
1.7
$
Q2
FY2022
Q3
75.1 $ 82.2
62.2 $
0.1
$
$
$
$
S 62.3 $ 71.3
83.0%
87.0%
$
FY2022
711
0.2
$
Q1
Q2
Q3
Q4
$ (15.4) $ (25.1) $ (21.5) $(227.2)
$
$
$
$
$
$ 1.5
$ 195.7
$ -
$
$
$
$
$
$
$ (13.7) $ (23.6) $ (20.0) $ (31.1)
-20.0%
-31.0% -24.0%
-32.0%
Q4
$ 96.6
$69.8
1.5
$
0.4
$ 13.5
$
$83.7
87.0%
0.4
FY2022
$320.8
$ 257.3
$
$
0.4
13.9
$
$ 271.6
85.0%
FY2022
$ (289.2)
$ 0.4
$ 200.4
$
$
$ (88.4)
-28.0%
Q1
Q2
Q3
Q4
$100.9 $ 113.9 $ 125.3 $135.8
$
$
$
81.5 $
3.3
FY2023
0.2 $
$
$
S 96.1
84.4%
$
$ 85.0
84.2%
92.3 $ 102.8 $ 112.3
0.2 $
0.2
3.6
0.3 $
0.3
3.7 $ 3.2
$
$
$ 106.7 $ 115.9
85.2% 85.3%
$
$
FY2023
Q3
Q4
Q1
Q2
$ (784) $ (78.6) $ (77.3) $ (62.9)
$
$ 46.3 $ 42.4
$
$
$
$
$
$
$ (32.0) $ (36.0) $ (30.4) $ (26.8)
-31,6% -24.2%
-31.7%
-19.7%
0.2 $ 0.3 $ 0.3
$ 46.7 $ 35.8
$
$
FY2023
$ 475.9
388.9
$
$ 13.8
$
$ 403.7
84.8%
1.0
FY2023
$ (297.2)
S
$ 1.0
$
171.2
$
$ (125.1)
-26.3%
FY2024
Q1
Q2
$ 138.0 $143.2
$ 111.2 $ 113.9
0.4 $ 0.4
$
4.1
$
0.4
$
$ 3.4
$
$ 115.0
83.3%
$118.8
FY2024
83.0%
Q1
Q2
$ (67.8) $ (82.6)
$ 0.4 $ 0.4
$ 40.2 $
46.1
$
$ 0.5
$
$ 0.5
s (27.2) (35.1)
-19.7%
-24.5%
1. In connection with tender offers and secondary sales of our common stock, stock-based compensation expense for fiscal 2020 and fiscal 2021, included $1.5 million and $32.1 million of expense, respectively, related to the amount paid in excess of the
estimated fair value of common stock as of the date of the transactions.
© 2023 HASHICORPView entire presentation