Maersk Investor Presentation Deck
Financial highlights Q1 2020
Improvements on all financials
USDm
10,000
1,000
500
0
9
9,571
9,540
Revenue
Q1 2020 interim report
1,521
1,236
EBITDA
552
320
EBIT
209
-104
Reported profit/loss
197
Financial highlights
Q1 2020
-69
Q1 2019
Underlying profit*
*Underlying profit/loss is profit/loss for the year from continuing operations adjusted for net gains/losses from sale of non-
current assets, etc. and net impairment losses as well as transaction, restructuring and integration costs related to major
transactions. The adjustments are net of tax and include A.P. Moller - Maersk's share of mentioned items in joint ventures
and associated companies.
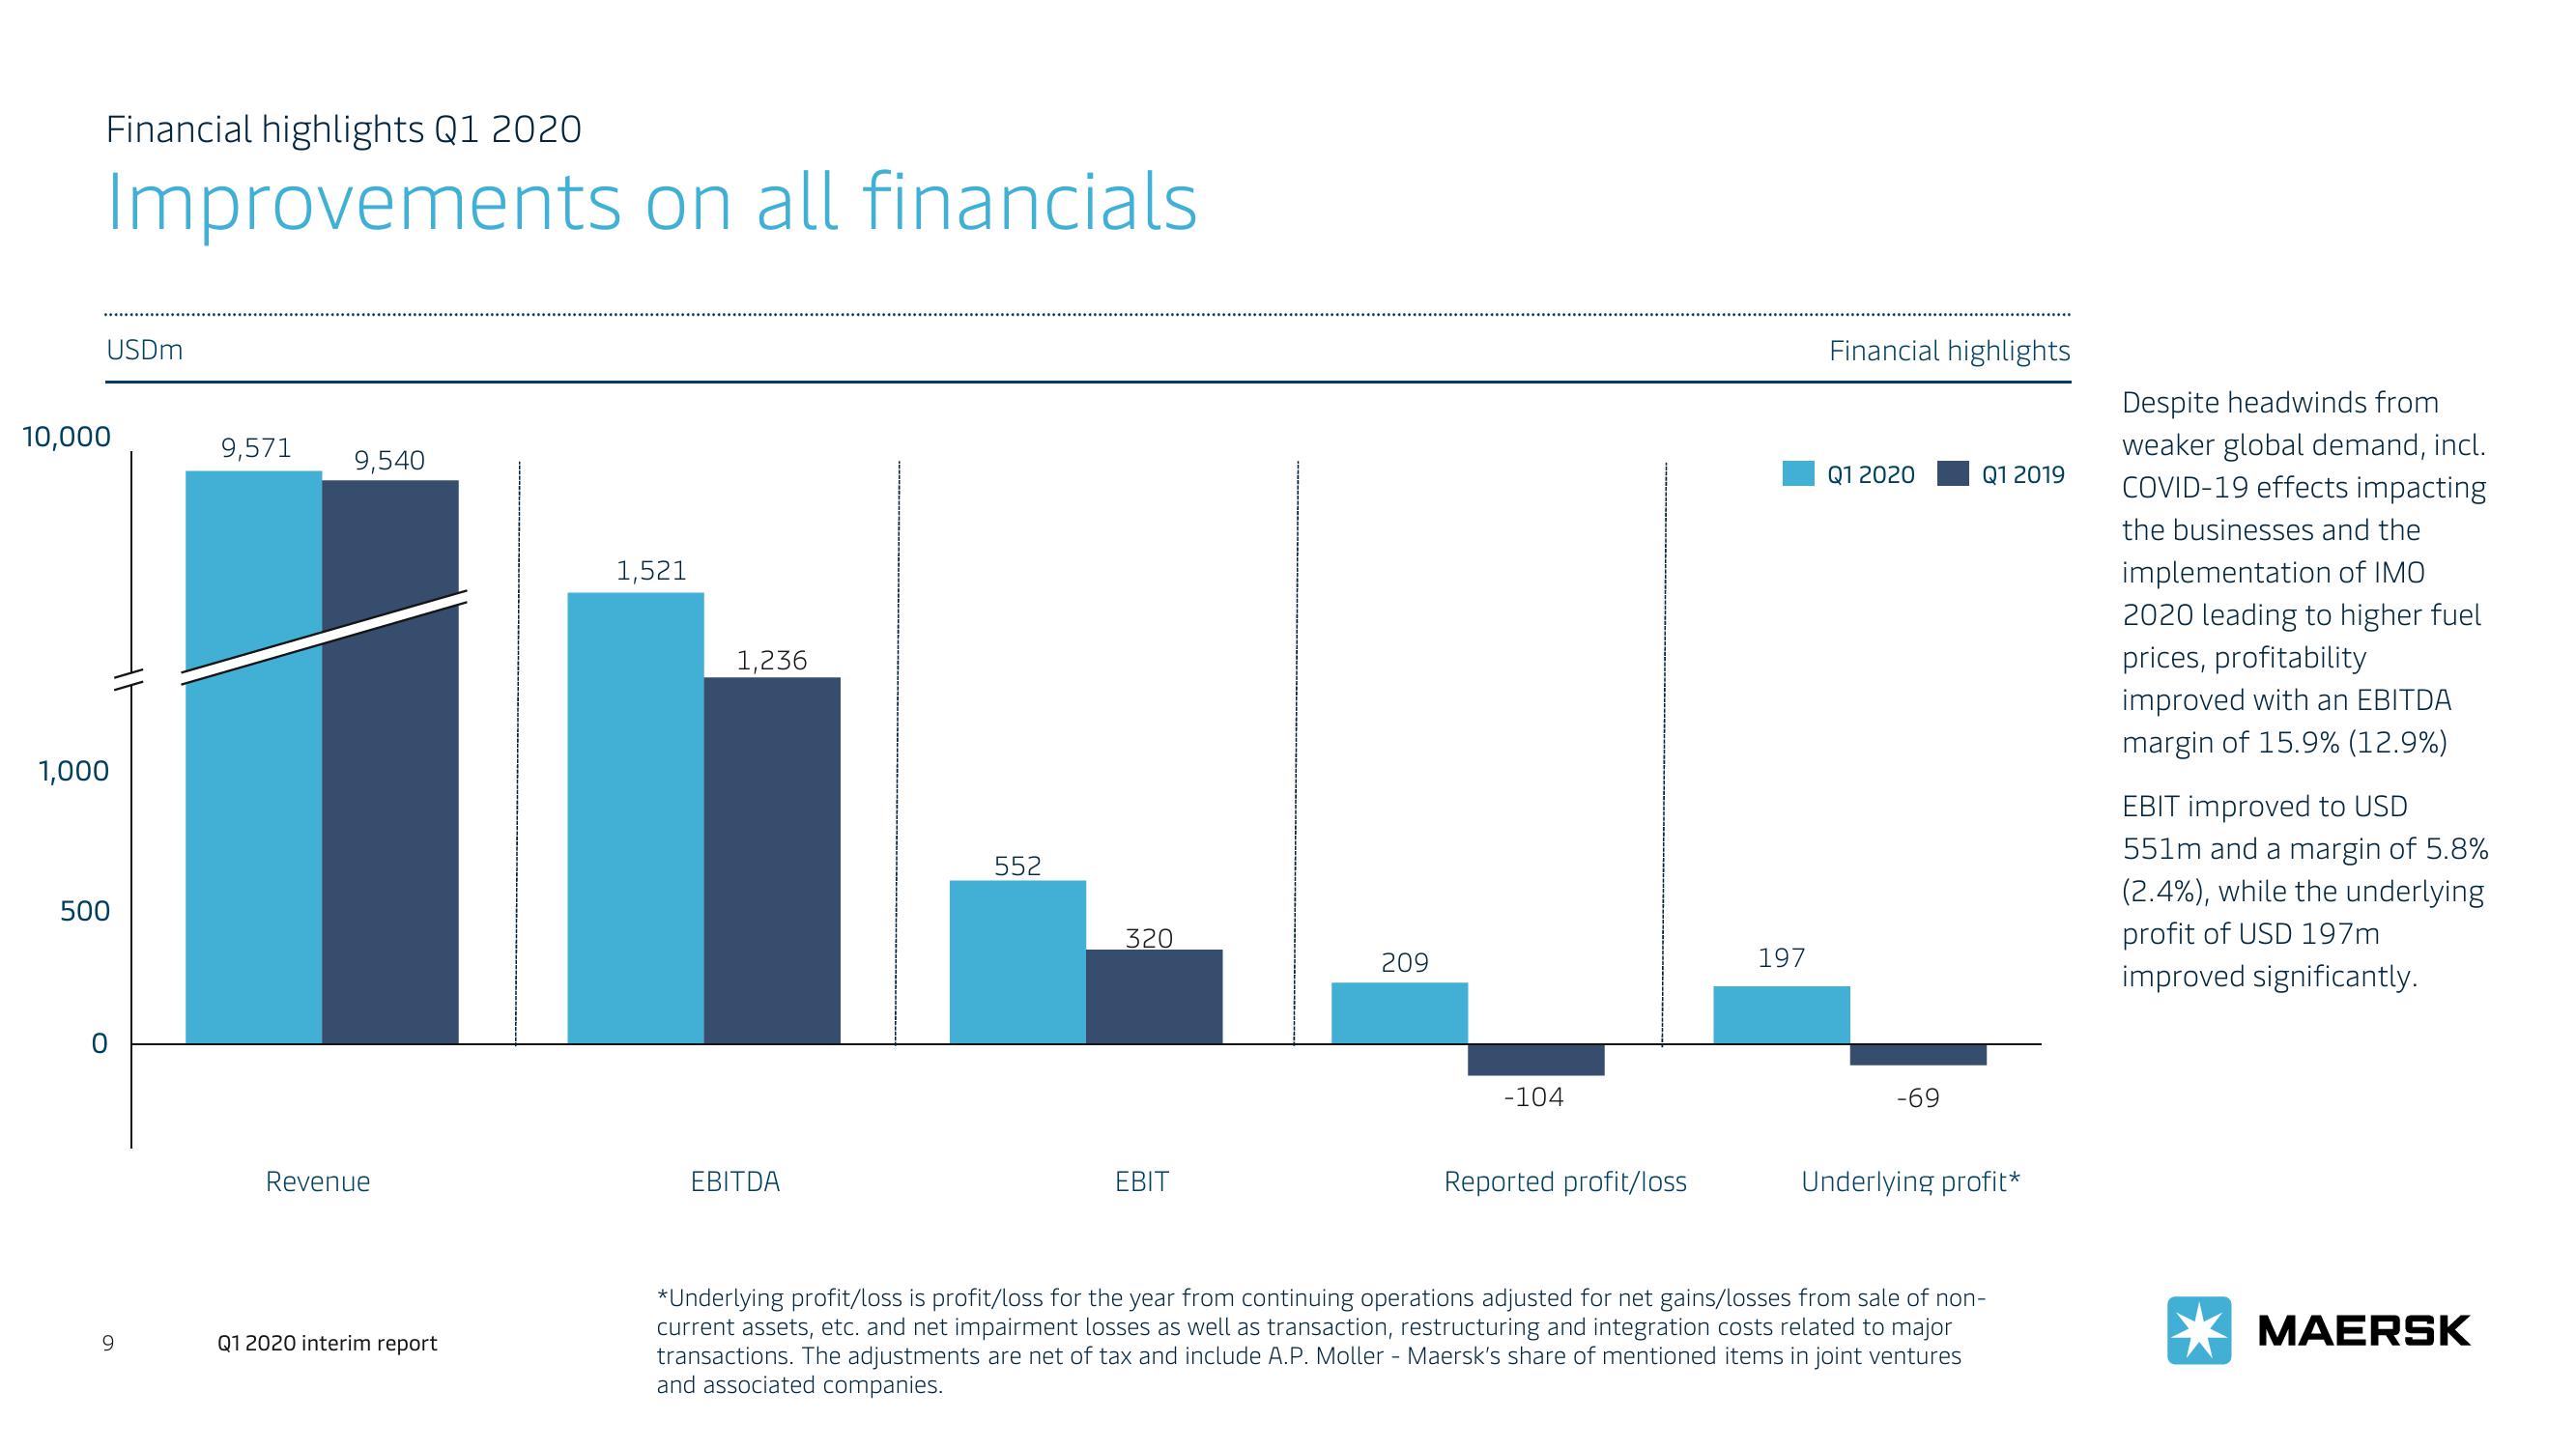
Despite headwinds from
weaker global demand, incl.
COVID-19 effects impacting
the businesses and the
implementation of IMO
2020 leading to higher fuel
prices, profitability
improved with an EBITDA
margin of 15.9% (12.9%)
EBIT improved to USD
551m and a margin of 5.8%
(2.4%), while the underlying
profit of USD 197m
improved significantly.
MAERSKView entire presentation