HSBC Results Presentation Deck
Loan and fee growth
Customer lending by global business, $bn
462
+$27bn
4Q20
489
4Q21
WPB
+$11bn
I ↓
338
349
4Q20
4Q21
CMB34
Includes the impact
of $30bn of gross
RWA saves
221
$(14)bn
4Q20
↓
207
4Q21
GBM
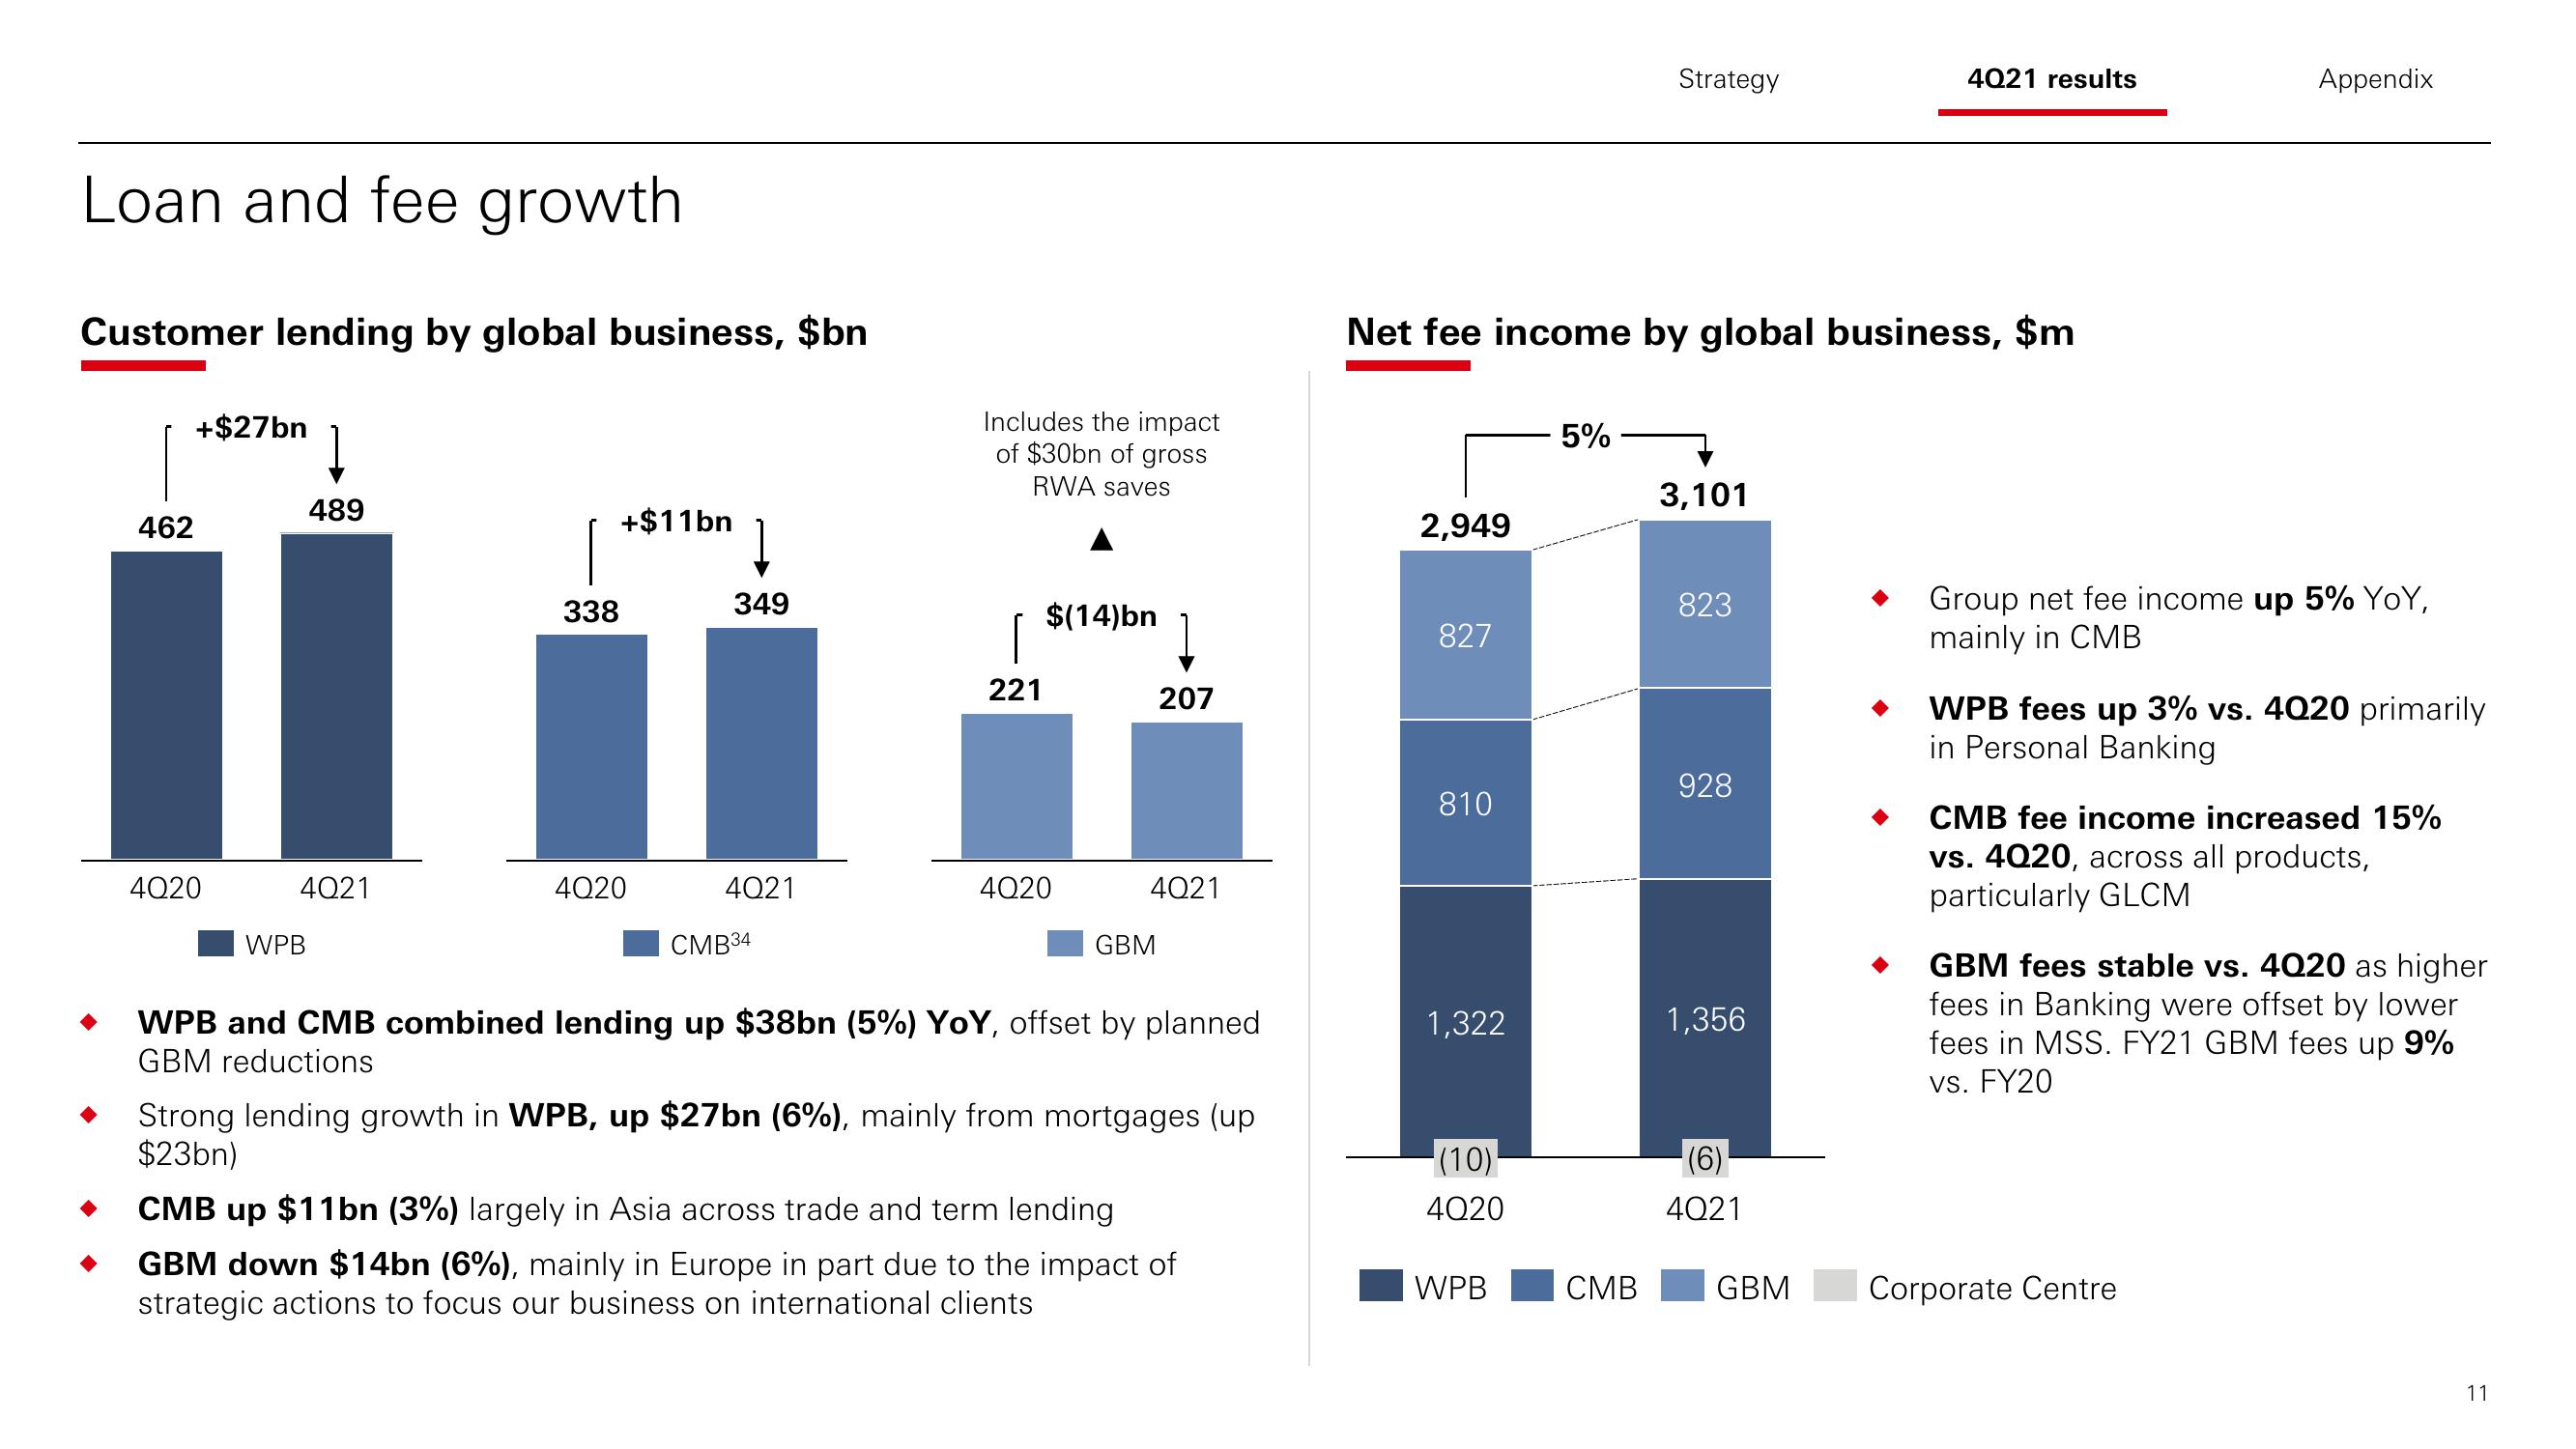
WPB and CMB combined lending up $38bn (5%) YoY, offset by planned
GBM reductions
Strong lending growth in WPB, up $27bn (6%), mainly from mortgages (up
$23bn)
CMB up $11bn (3%) largely in Asia across trade and term lending
GBM down $14bn (6%), mainly in Europe in part due to the impact of
strategic actions to focus our business on international clients
2,949
Net fee income by global business, $m
827
810
1,322
(10)
4Q20
WPB
5%
Strategy
CMB
3,101
823
928
1,356
(6)
4Q21
4021 results
GBM
Appendix
Group net fee income up 5% YOY,
mainly in CMB
WPB fees up 3% vs. 4020 primarily
in Personal Banking
CMB fee income increased 15%
vs. 4020, across all products,
particularly GLCM
GBM fees stable vs. 4020 as higher
fees in Banking were offset by lower
fees in MSS. FY21 GBM fees up 9%
vs. FY20
Corporate Centre
11View entire presentation