Azure Power Investor Presentation
Operating Assets Review: EBITDA, CFe, & Leverage
EBITDA from Operating
Assets (in US$ Mn)
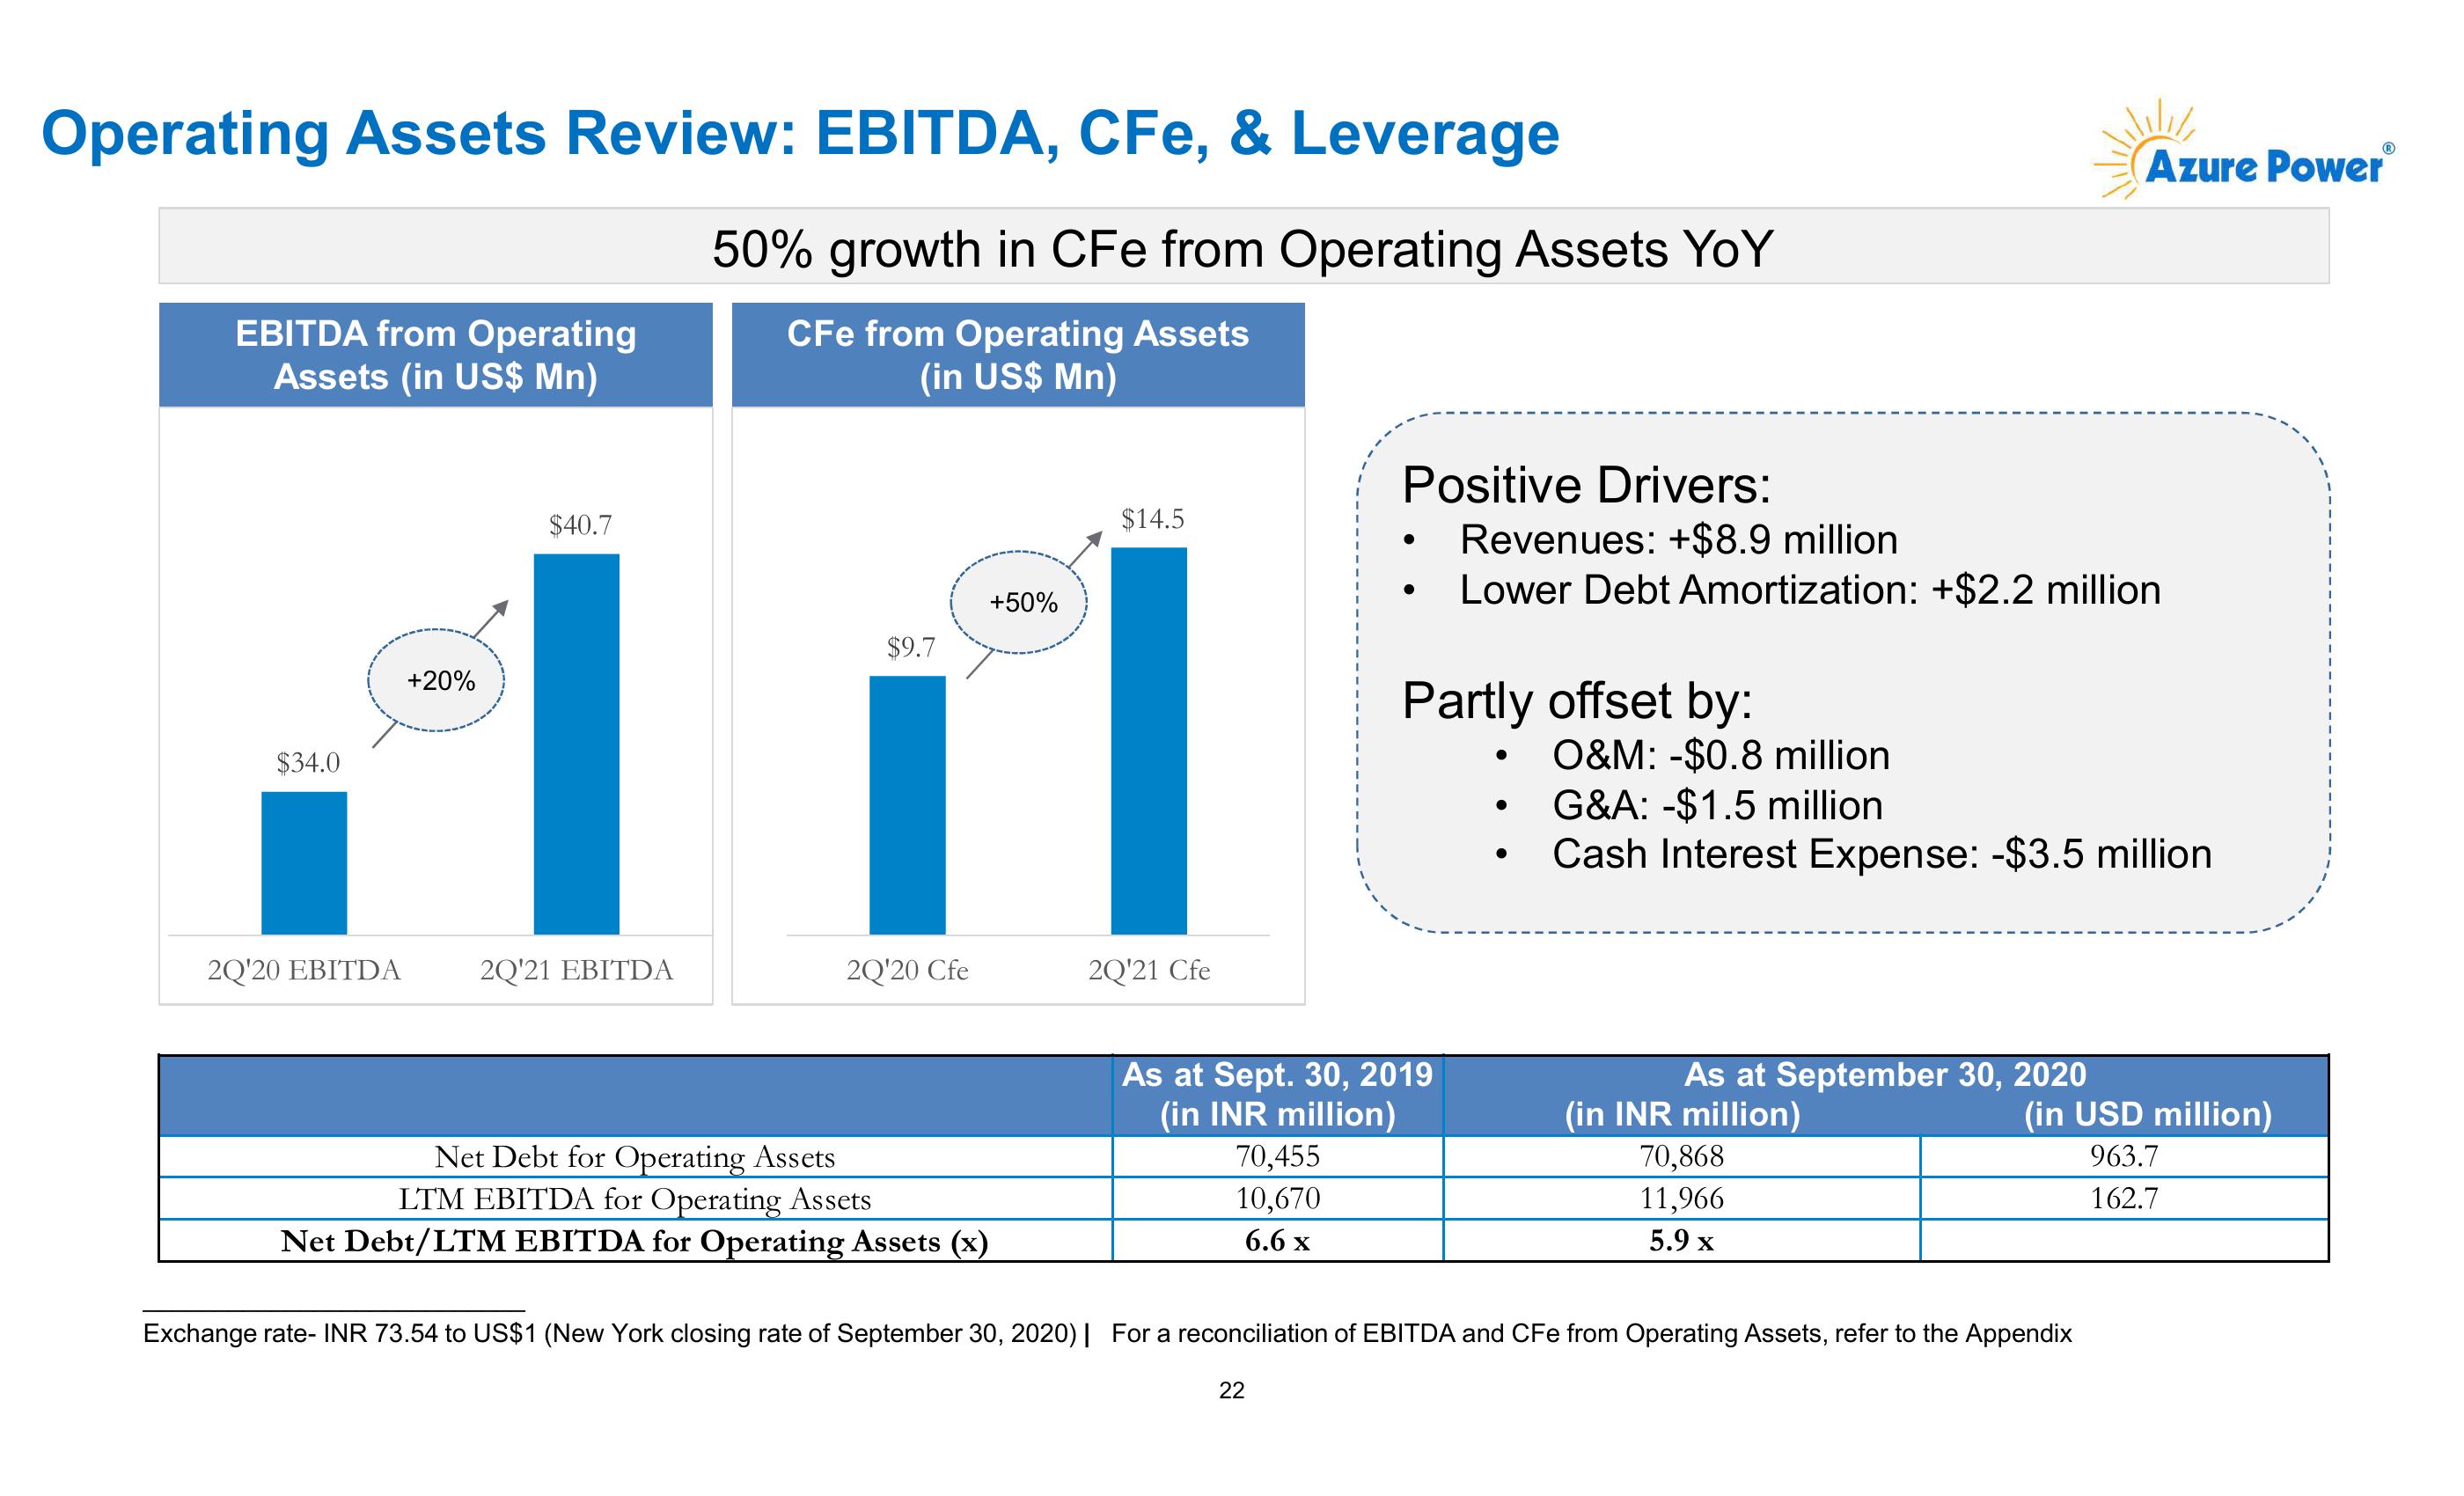
50% growth in CFe from Operating Assets YoY
CFe from Operating Assets
(in US$ Mn)
$34.0
+20%
$40.7
+50%
$9.7
$14.5
•
2Q'20 EBITDA
2Q'21 EBITDA
2Q'20 Cfe
2Q'21 Cfe
Azure Power
Positive Drivers:
Revenues: +$8.9 million
Lower Debt Amortization: +$2.2 million
Partly offset by:
•
O&M: -$0.8 million
G&A: -$1.5 million
Cash Interest Expense: -$3.5 million
As at Sept. 30, 2019
As at September 30, 2020
(in INR million)
(in INR million)
(in USD million)
Net Debt for Operating Assets
LTM EBITDA for Operating Assets
Net Debt/LTM EBITDA for Operating Assets (x)
70,455
10,670
6.6 x
70,868
11,966
5.9 x
Exchange rate- INR 73.54 to US$1 (New York closing rate of September 30, 2020) | For a reconciliation of EBITDA and CFe from Operating Assets, refer to the Appendix
22
22
963.7
162.7View entire presentation