Immix Biopharma Investor Presentation Deck
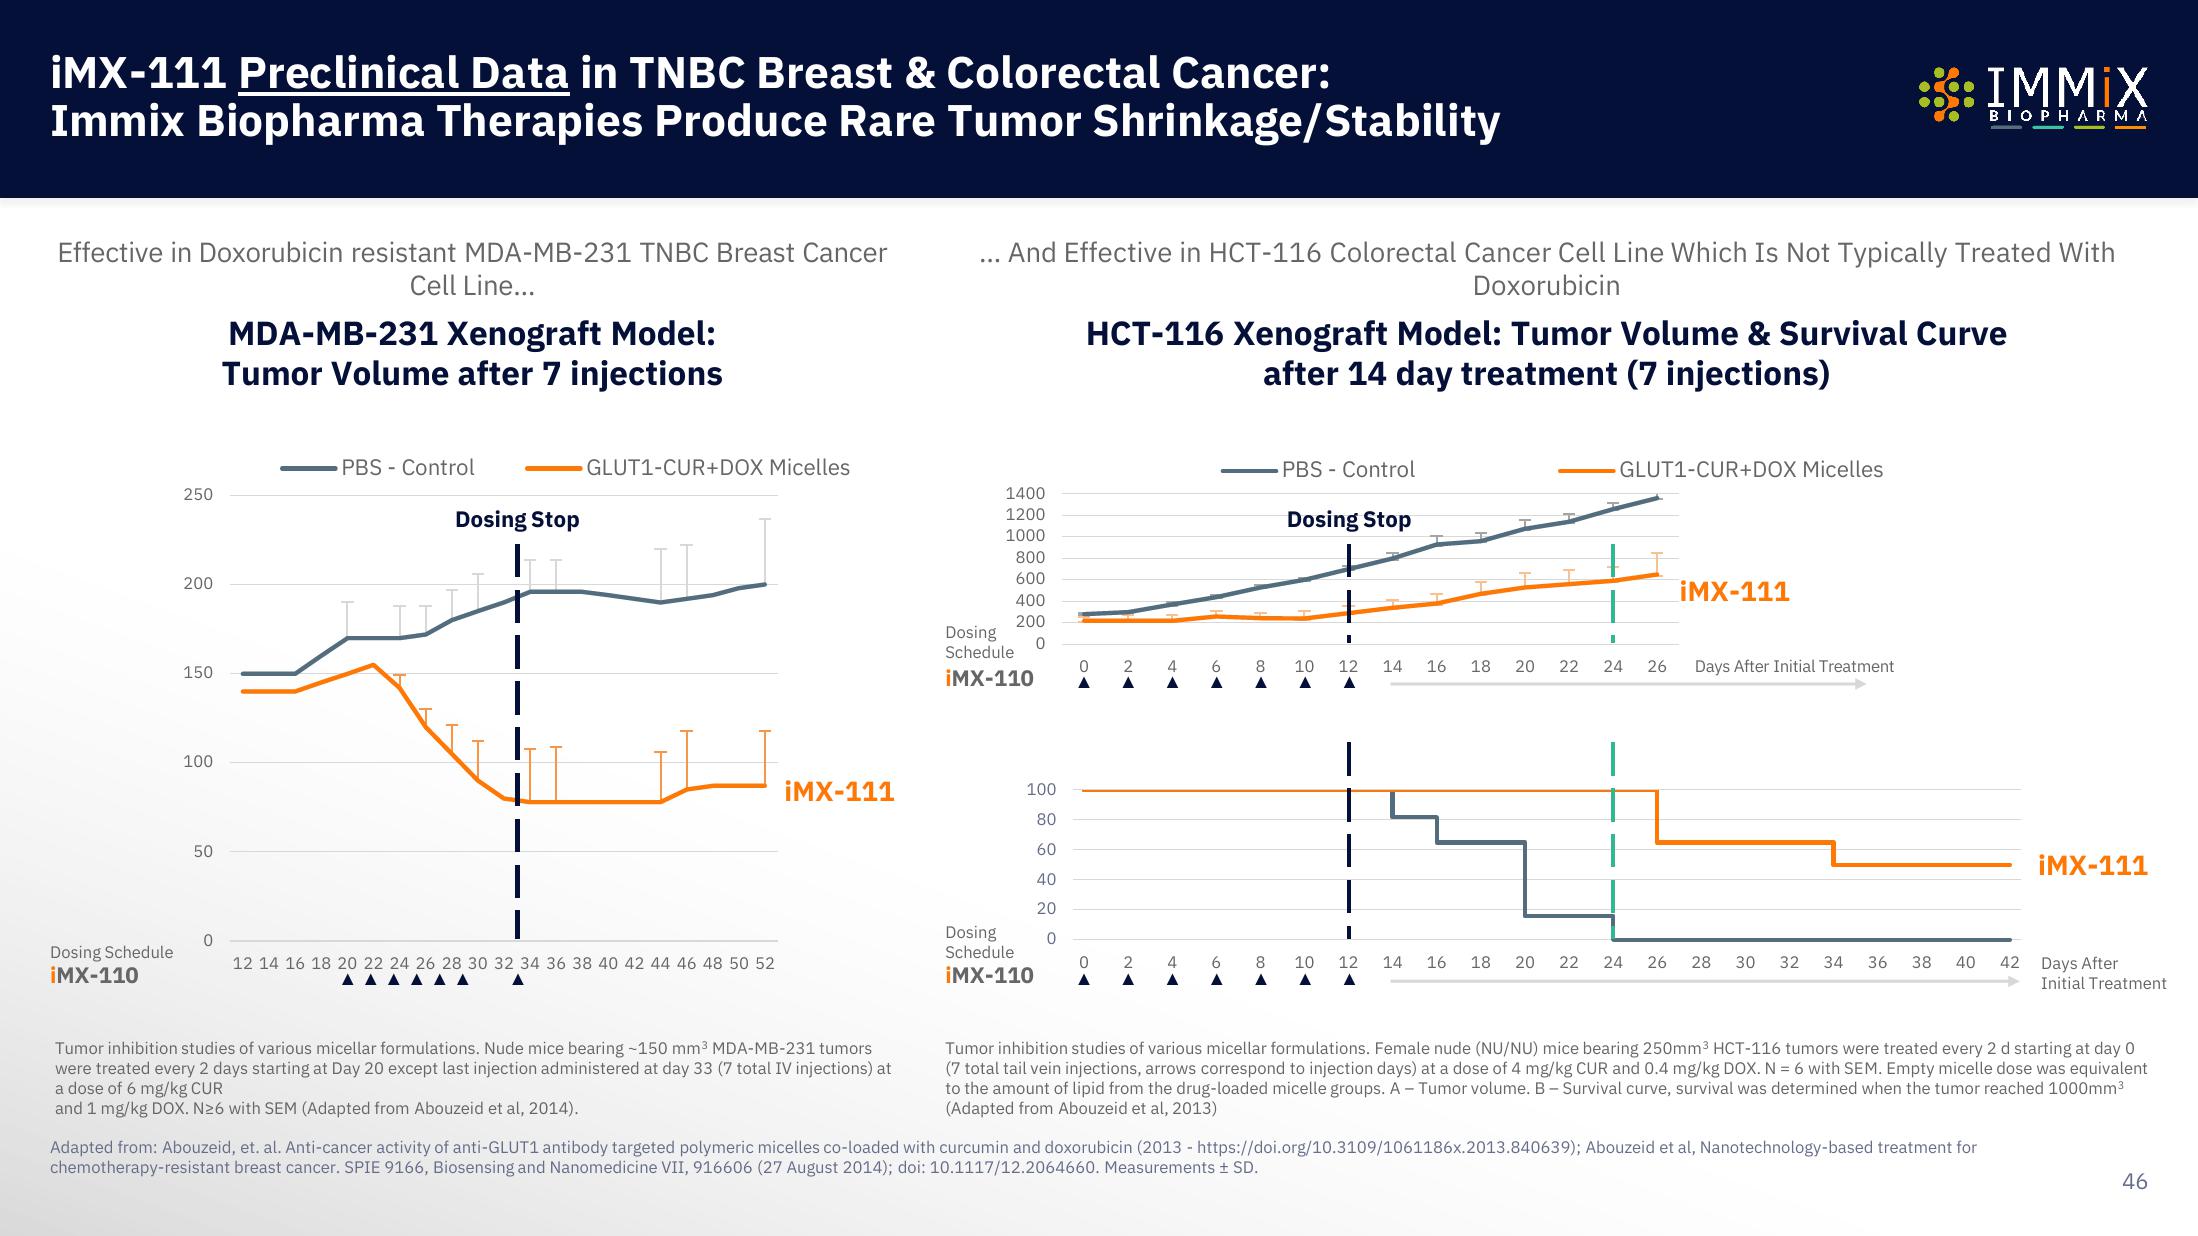
iMX-111 Preclinical Data in TNBC Breast & Colorectal Cancer:
Immix Biopharma Therapies Produce Rare Tumor Shrinkage/Stability
Effective in Doxorubicin resistant MDA-MB-231 TNBC Breast Cancer
Cell Line...
Dosing Schedule
¡MX-110
250
200
150
100
50
0
MDA-MB-231 Xenograft Model:
Tumor Volume after 7 injections
PBS Control
Dosing Stop
I
I
I
GLUT1-CUR+DOX Micelles
12 14 16 18 20 22 24 26 28 30 32 34 36 38 40 42 44 46 48 50 52
▲▲▲▲▲▲
iMX-111
Tumor inhibition studies of various micellar formulations. Nude mice bearing -150 mm³ MDA-MB-231 tumors
were treated every 2 days starting at Day 20 except last injection administered at day 33 (7 total IV injections) at
a dose of 6 mg/kg CUR
and 1 mg/kg DOX. N26 with SEM (Adapted from Abouzeid et al, 2014).
. And Effective in HCT-116 Colorectal Cancer Cell Line Which Is Not Typically Treated With
Doxorubicin
1400
1200
1000
800
600
400
200
0
Dosing
Schedule
iMX-110
100
80
60
40
20
0
Dosing
Schedule
iMX-110
HCT-116 Xenograft Model: Tumor Volume & Survival Curve
after 14 day treatment (7 injections)
0
2
0 2
A A
4
4
6
6
A
8
A
8
A
-PBS - Control
Dosing Stop
I
10 12 14 16 18 20
|
1
10 12 14
A
16 18
20
T
22
GLUT1-CUR+DOX Micelles
+
I
22 24 26
24 26
iMX-111
●●●
IMMİX
S BIOPHARMA
Days After Initial Treatment
28 30 32 34 36
38 40
42
Adapted from: Abouzeid, et. al. Anti-cancer activity of anti-GLUT1 antibody targeted polymeric micelles co-loaded with curcumin and doxorubicin (2013 - https://doi.org/10.3109/1061186x.2013.840639); Abouzeid et al, Nanotechnology-based treatment for
chemotherapy-resistant breast cancer. SPIE 9166, Biosensing and Nanomedicine VII, 916606 (27 August 2014); doi: 10.1117/12.2064660. Measurements + SD.
¡MX-111
Days After
Initial Treatment
Tumor inhibition studies of various micellar formulations. Female nude (NU/NU) mice bearing 250mm³ HCT-116 tumors were treated every 2 d starting at day 0
(7 total tail vein injections, arrows correspond to injection days) at a dose of 4 mg/kg CUR and 0.4 mg/kg DOX. N = 6 with SEM. Empty micelle dose was equivalent
to the amount of lipid from the drug-loaded micelle groups. A - Tumor volume. B- Survival curve, survival was determined when the tumor reached 1000mm³
(Adapted from Abouzeid et al, 2013)
46View entire presentation