Paysafe Results Presentation Deck
Integrated Processing segment
Paysafe:
Pay Later-
●
●
●
Volume ($bn)
$17.1
$16.8
Q2 2020
+54%
$26.4
Q2 2021
+57%
Ex. PL
Pay Later
take rate
Revenue ($m)
$178.4
$169.6
Q2 2020
1.0%
+7%
+13%
Ex. PL
$191.2
Q2 2021
0.7%
Pay Later
Adj. EBITDA ($m)
$52.0
$50.3
Q2 2020
margin 29.2%
-12%
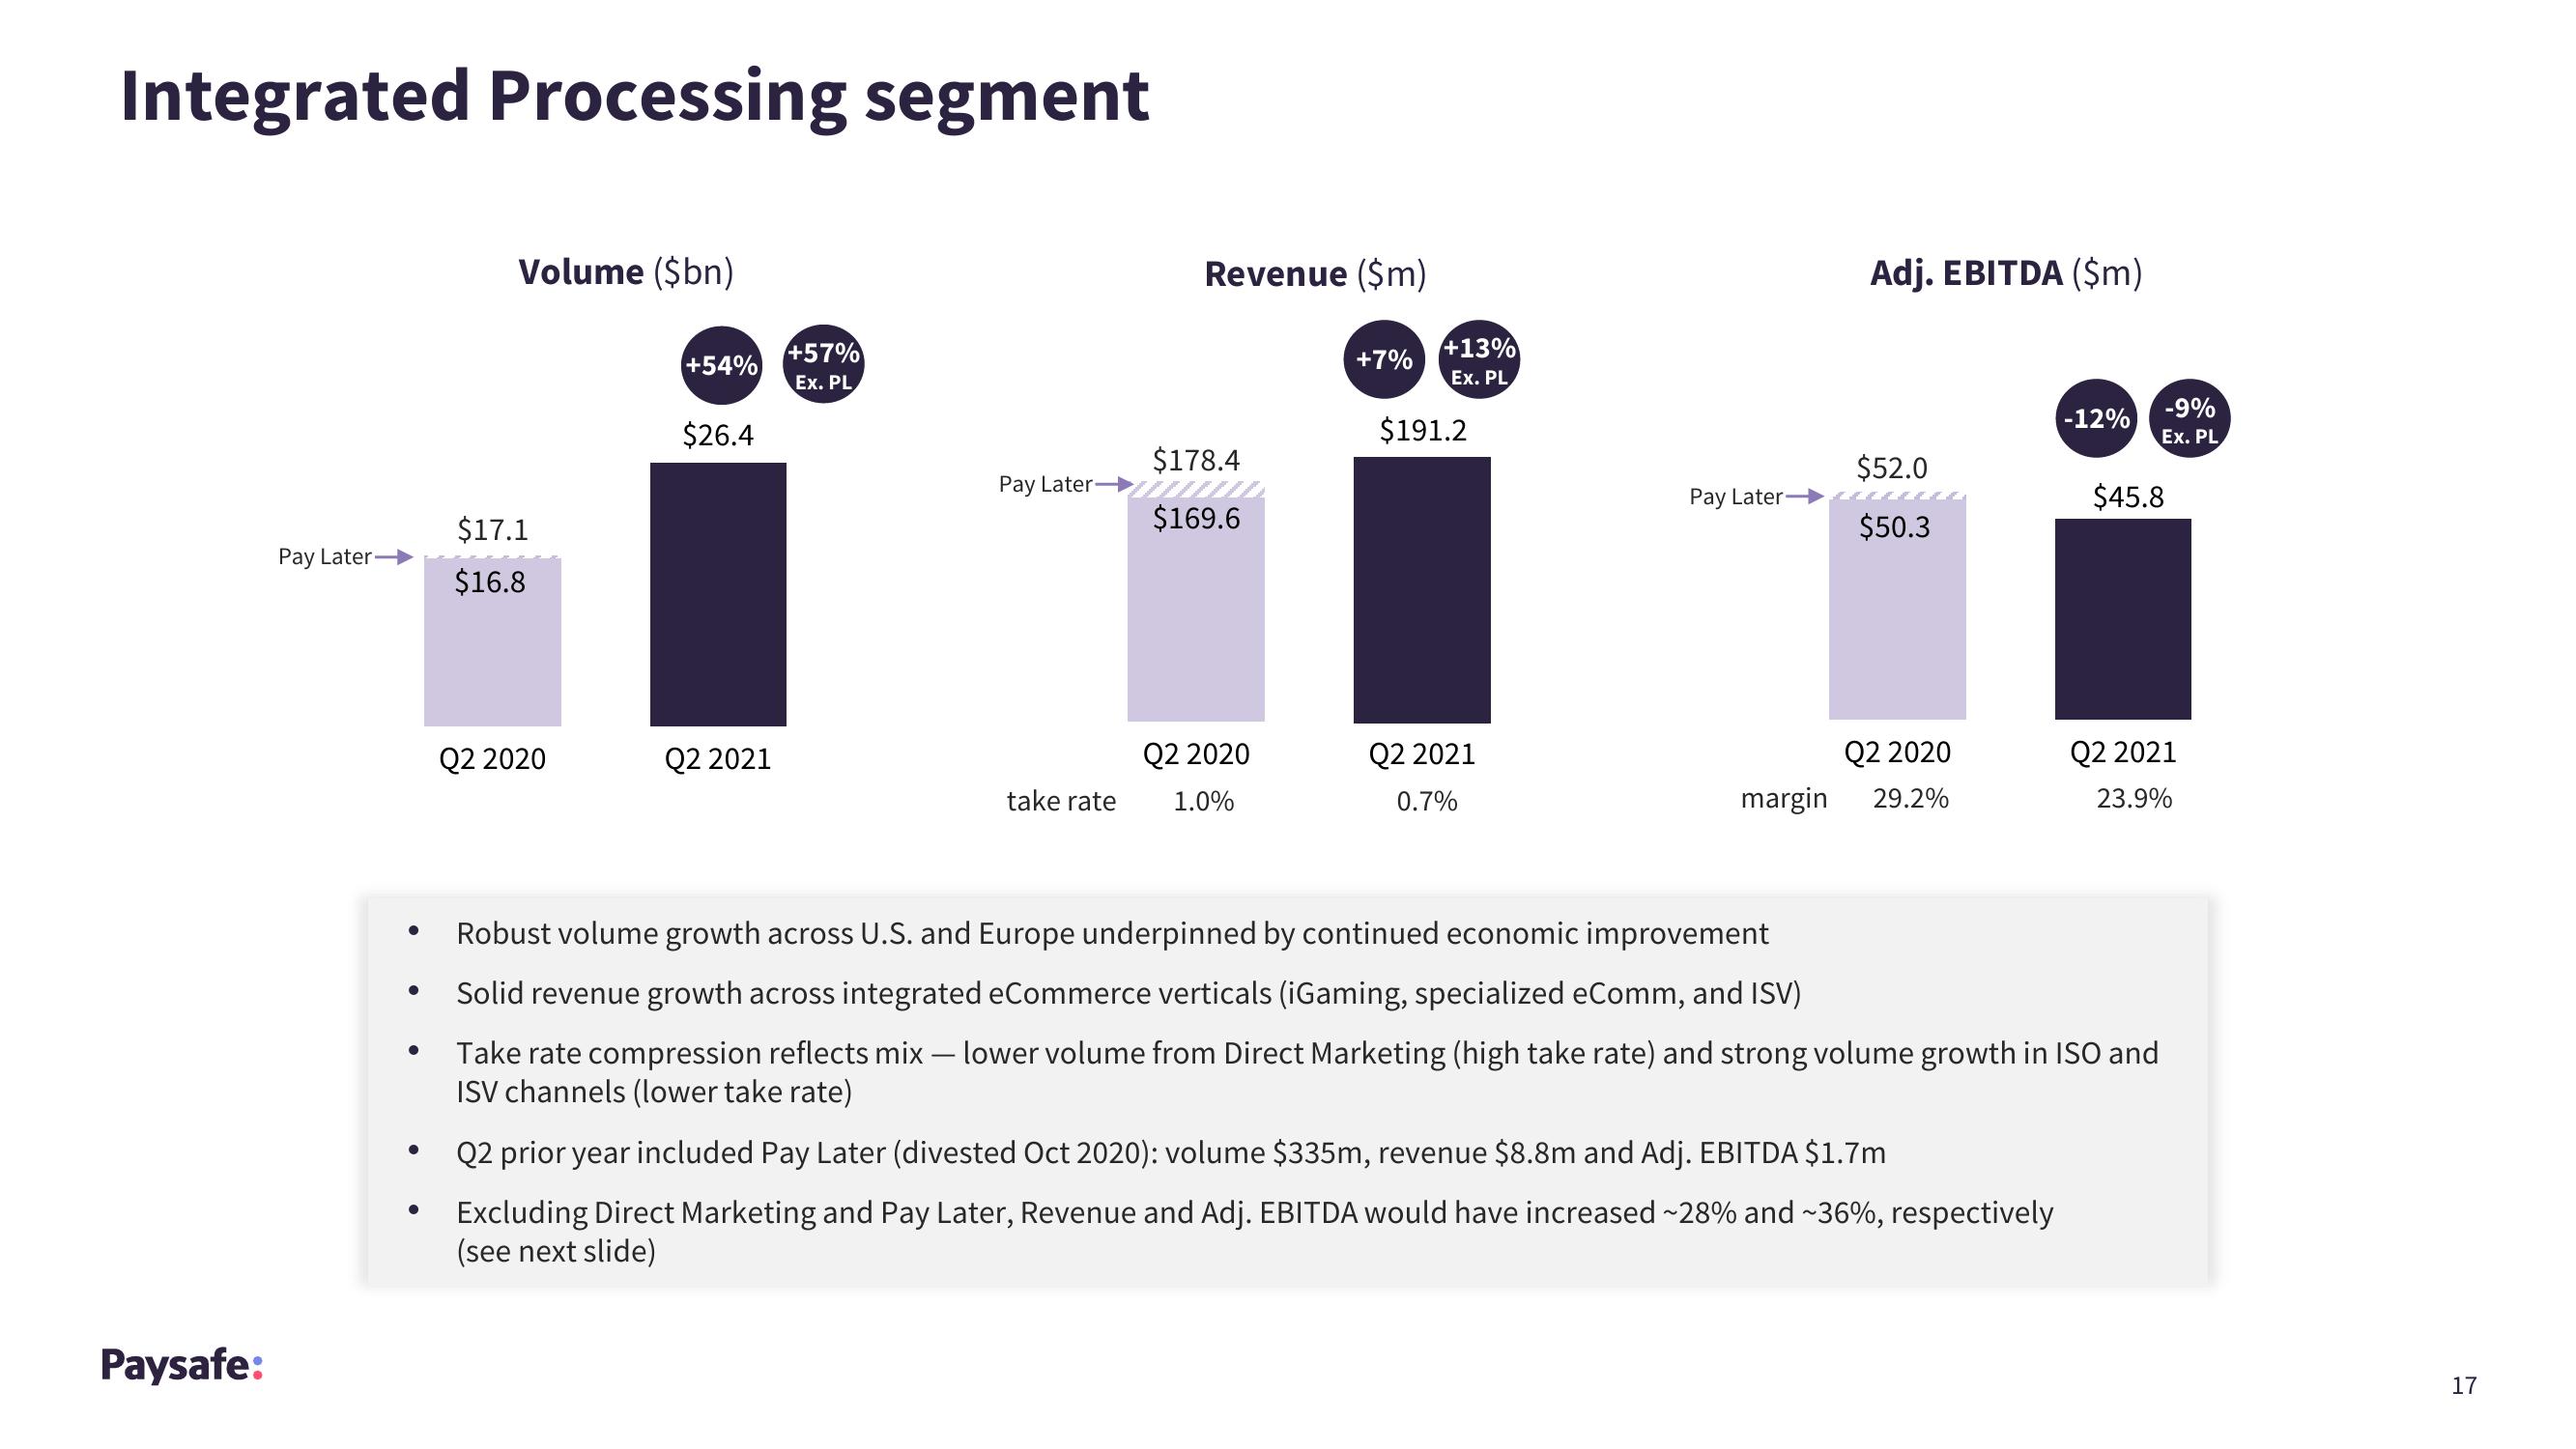
Q2 prior year included Pay Later (divested Oct 2020): volume $335m, revenue $8.8m and Adj. EBITDA $1.7m
Excluding Direct Marketing and Pay Later, Revenue and Adj. EBITDA would have increased ~28% and ~36%, respectively
(see next slide)
-9%
Ex. PL
$45.8
Robust volume growth across U.S. and Europe underpinned by continued economic improvement
Solid revenue growth across integrated eCommerce verticals (iGaming, specialized eComm, and ISV)
Take rate compression reflects mix - lower volume from Direct Marketing (high take rate) and strong volume growth in ISO and
ISV channels (lower take rate)
Q2 2021
23.9%
17View entire presentation