Mesirow Private Equity
1.
1
2.
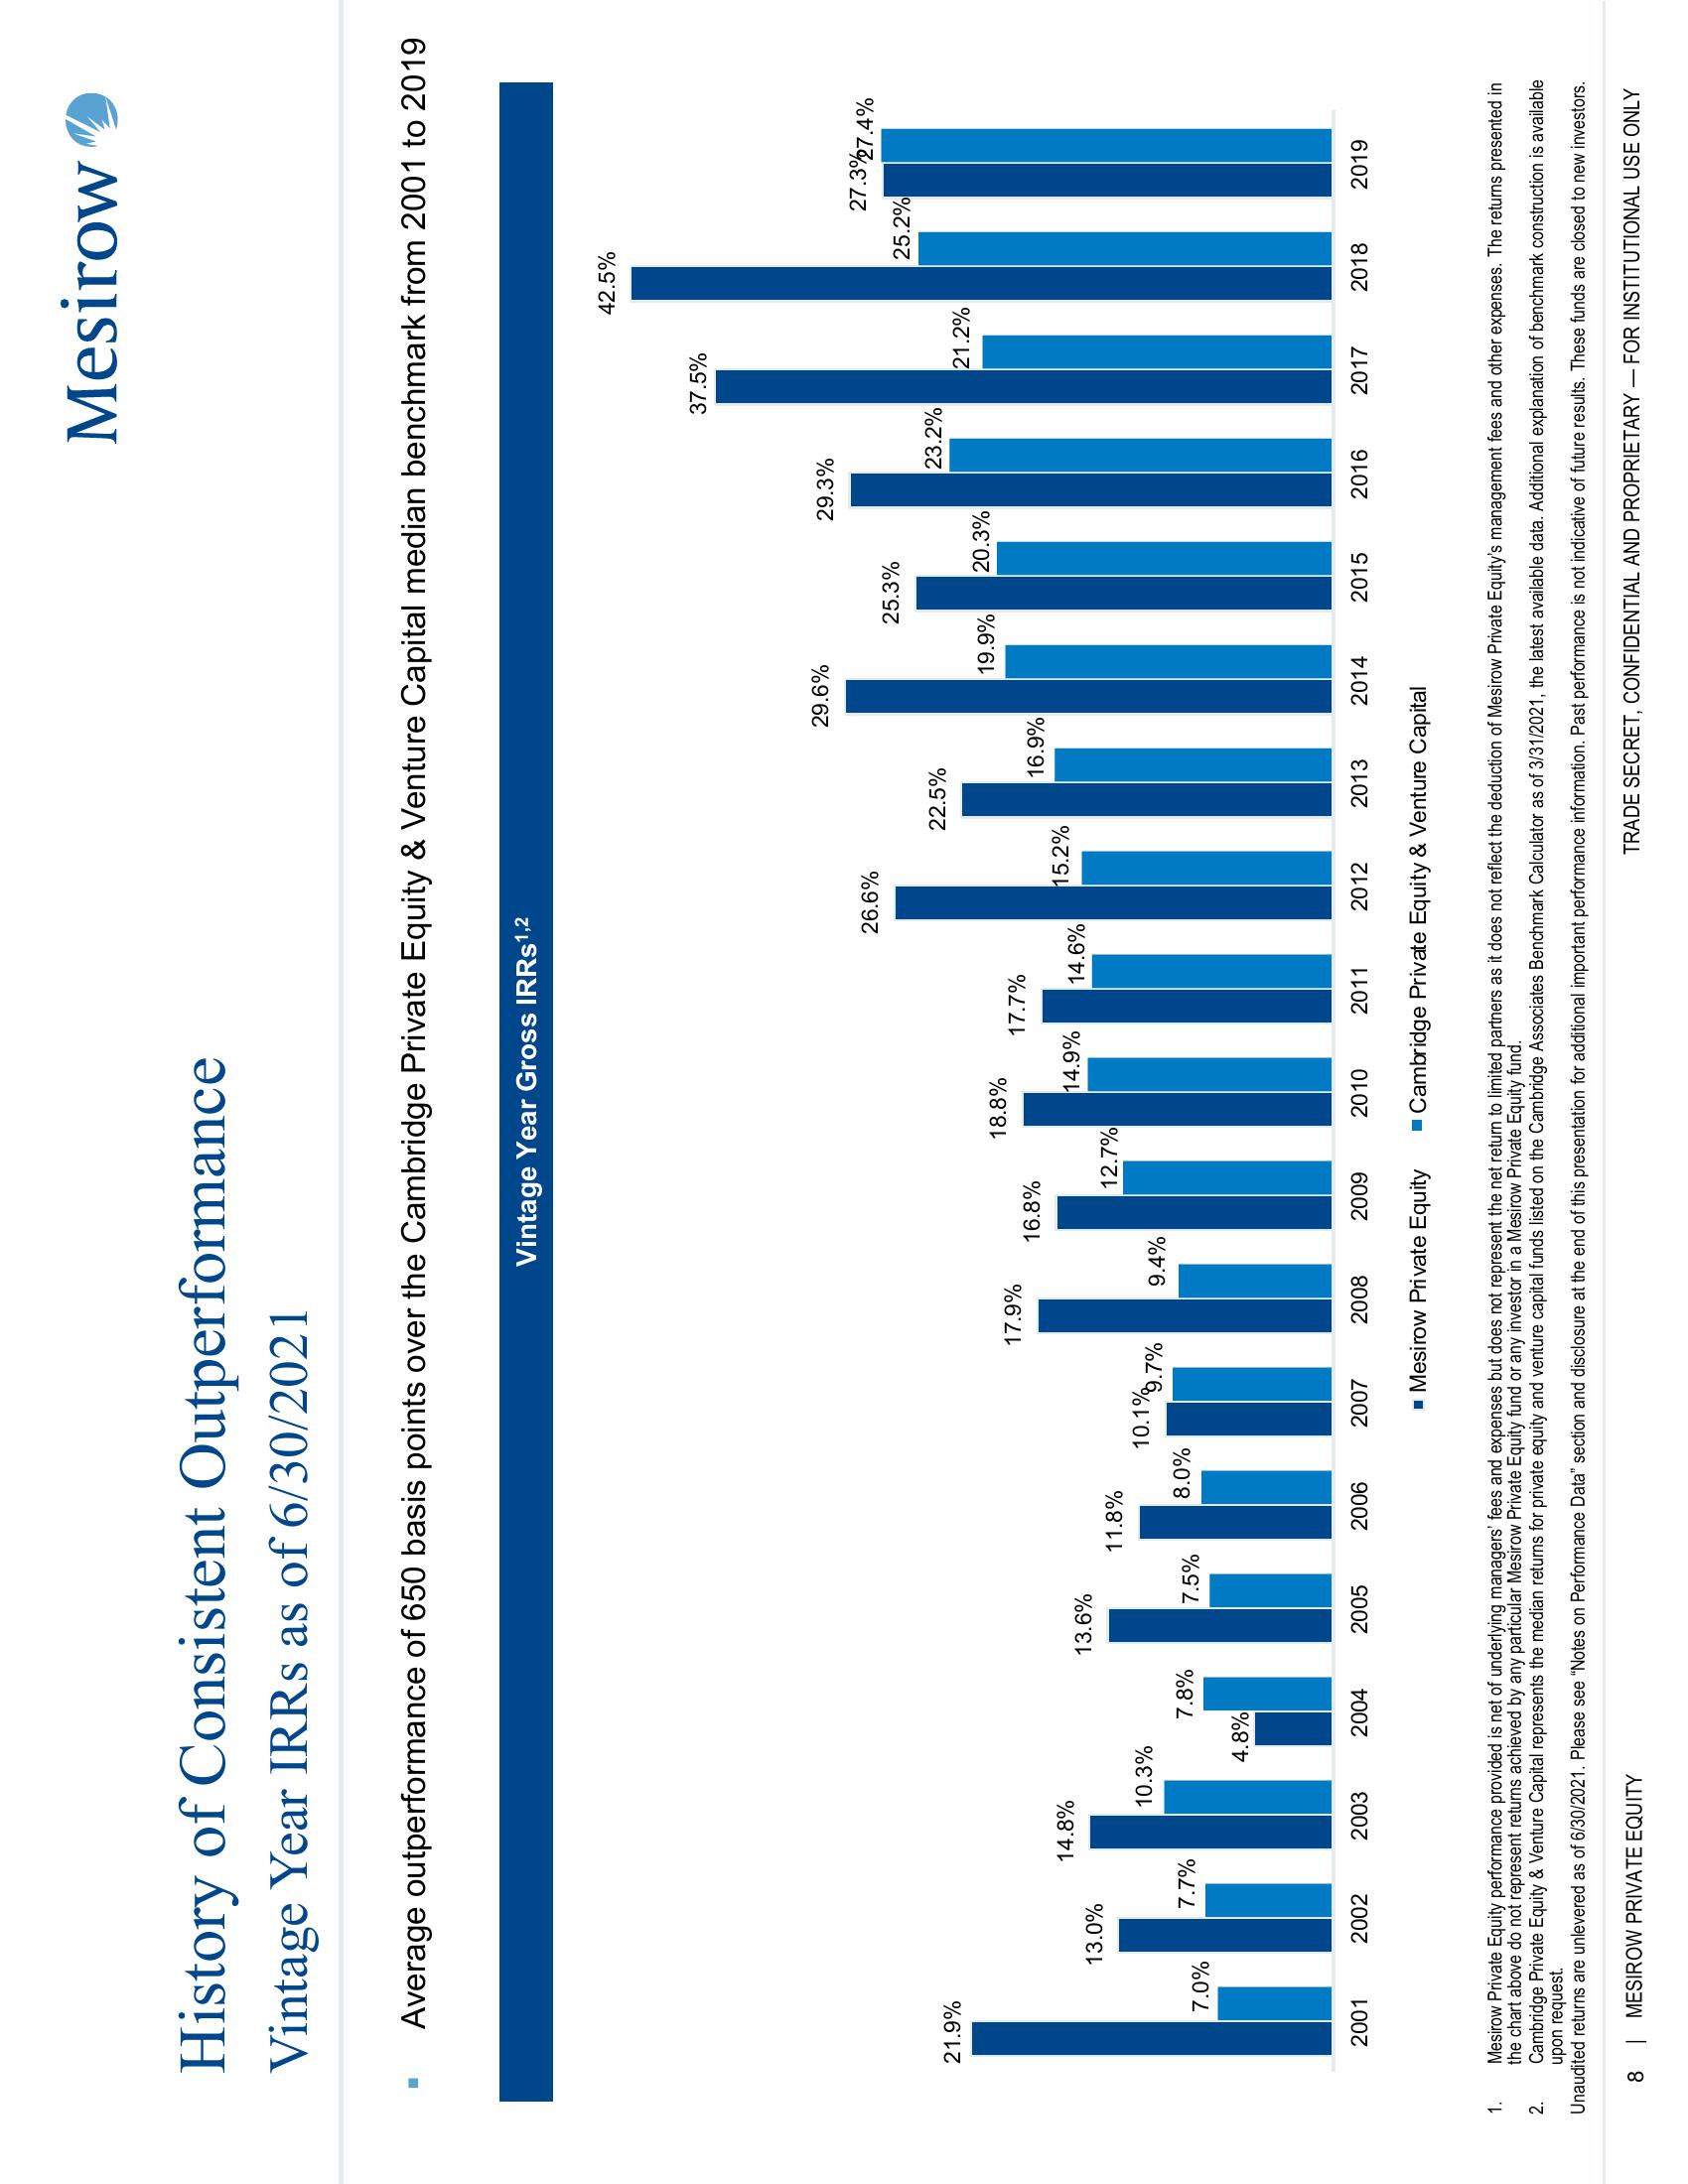
History of Consistent Outperformance
Vintage Year IRRs as of 6/30/2021
Average outperformance of 650 basis points over the Cambridge Private Equity & Venture Capital median benchmark from 2001 to 2019
14.8%
13.6%
13.0%
haban
10.3%
7.7%
7.8%
7.0%
4.8%
21.9%
2001
2002
2003
2004
7.5%
2005
11.8%
8.0%
2006
17.9%
10.1%.7%
2007
Vintage Year Gross IRRs¹,2
2008
16.8%
9.4%
12.7%
2009
18.8%
■ Mesirow Private Equity
17.7%
14.9%
2010
26.6%
14.6%
2011
22.5%
15.2%
2012
29.6%
16.9%
2013
2014
■Cambridge Private Equity & Venture Capital
25.3%
19.9% 20.3%
29.3%
2015
Mesirow
2016
37.5%
23.2%
42.5%
21.2%
2017
27.3%7.4%
25.2%
2018
Mesirow Private Equity performance provided is net of underlying managers' fees and expenses but does not represent the net return to limited partners as it does not reflect the deduction of Mesirow Private Equity's management fees and other expenses. The returns presented in
the chart above do not represent returns achieved by any particular Mesirow Private Equity fund or any investor in a Mesirow Private Equity fund.
Cambridge Private Equity & Venture Capital represents the median returns for private equity and venture capital funds listed on the Cambridge Associates Benchmark Calculator as of 3/31/2021, the latest available data. Additional explanation of benchmark construction is available
upon request.
Unaudited returns are unlevered as of 6/30/2021. Please see "Notes on Performance Data" section and disclosure at the end of this presentation for additional important performance information. Past performance is not indicative of future results. These funds are closed to new investors.
8 MESIROW PRIVATE EQUITY
TRADE SECRET, CONFIDENTIAL AND PROPRIETARY FOR INSTITUTIONAL USE ONLY
2019View entire presentation