Q4 2020 Investor Presentation
Liquidity
"
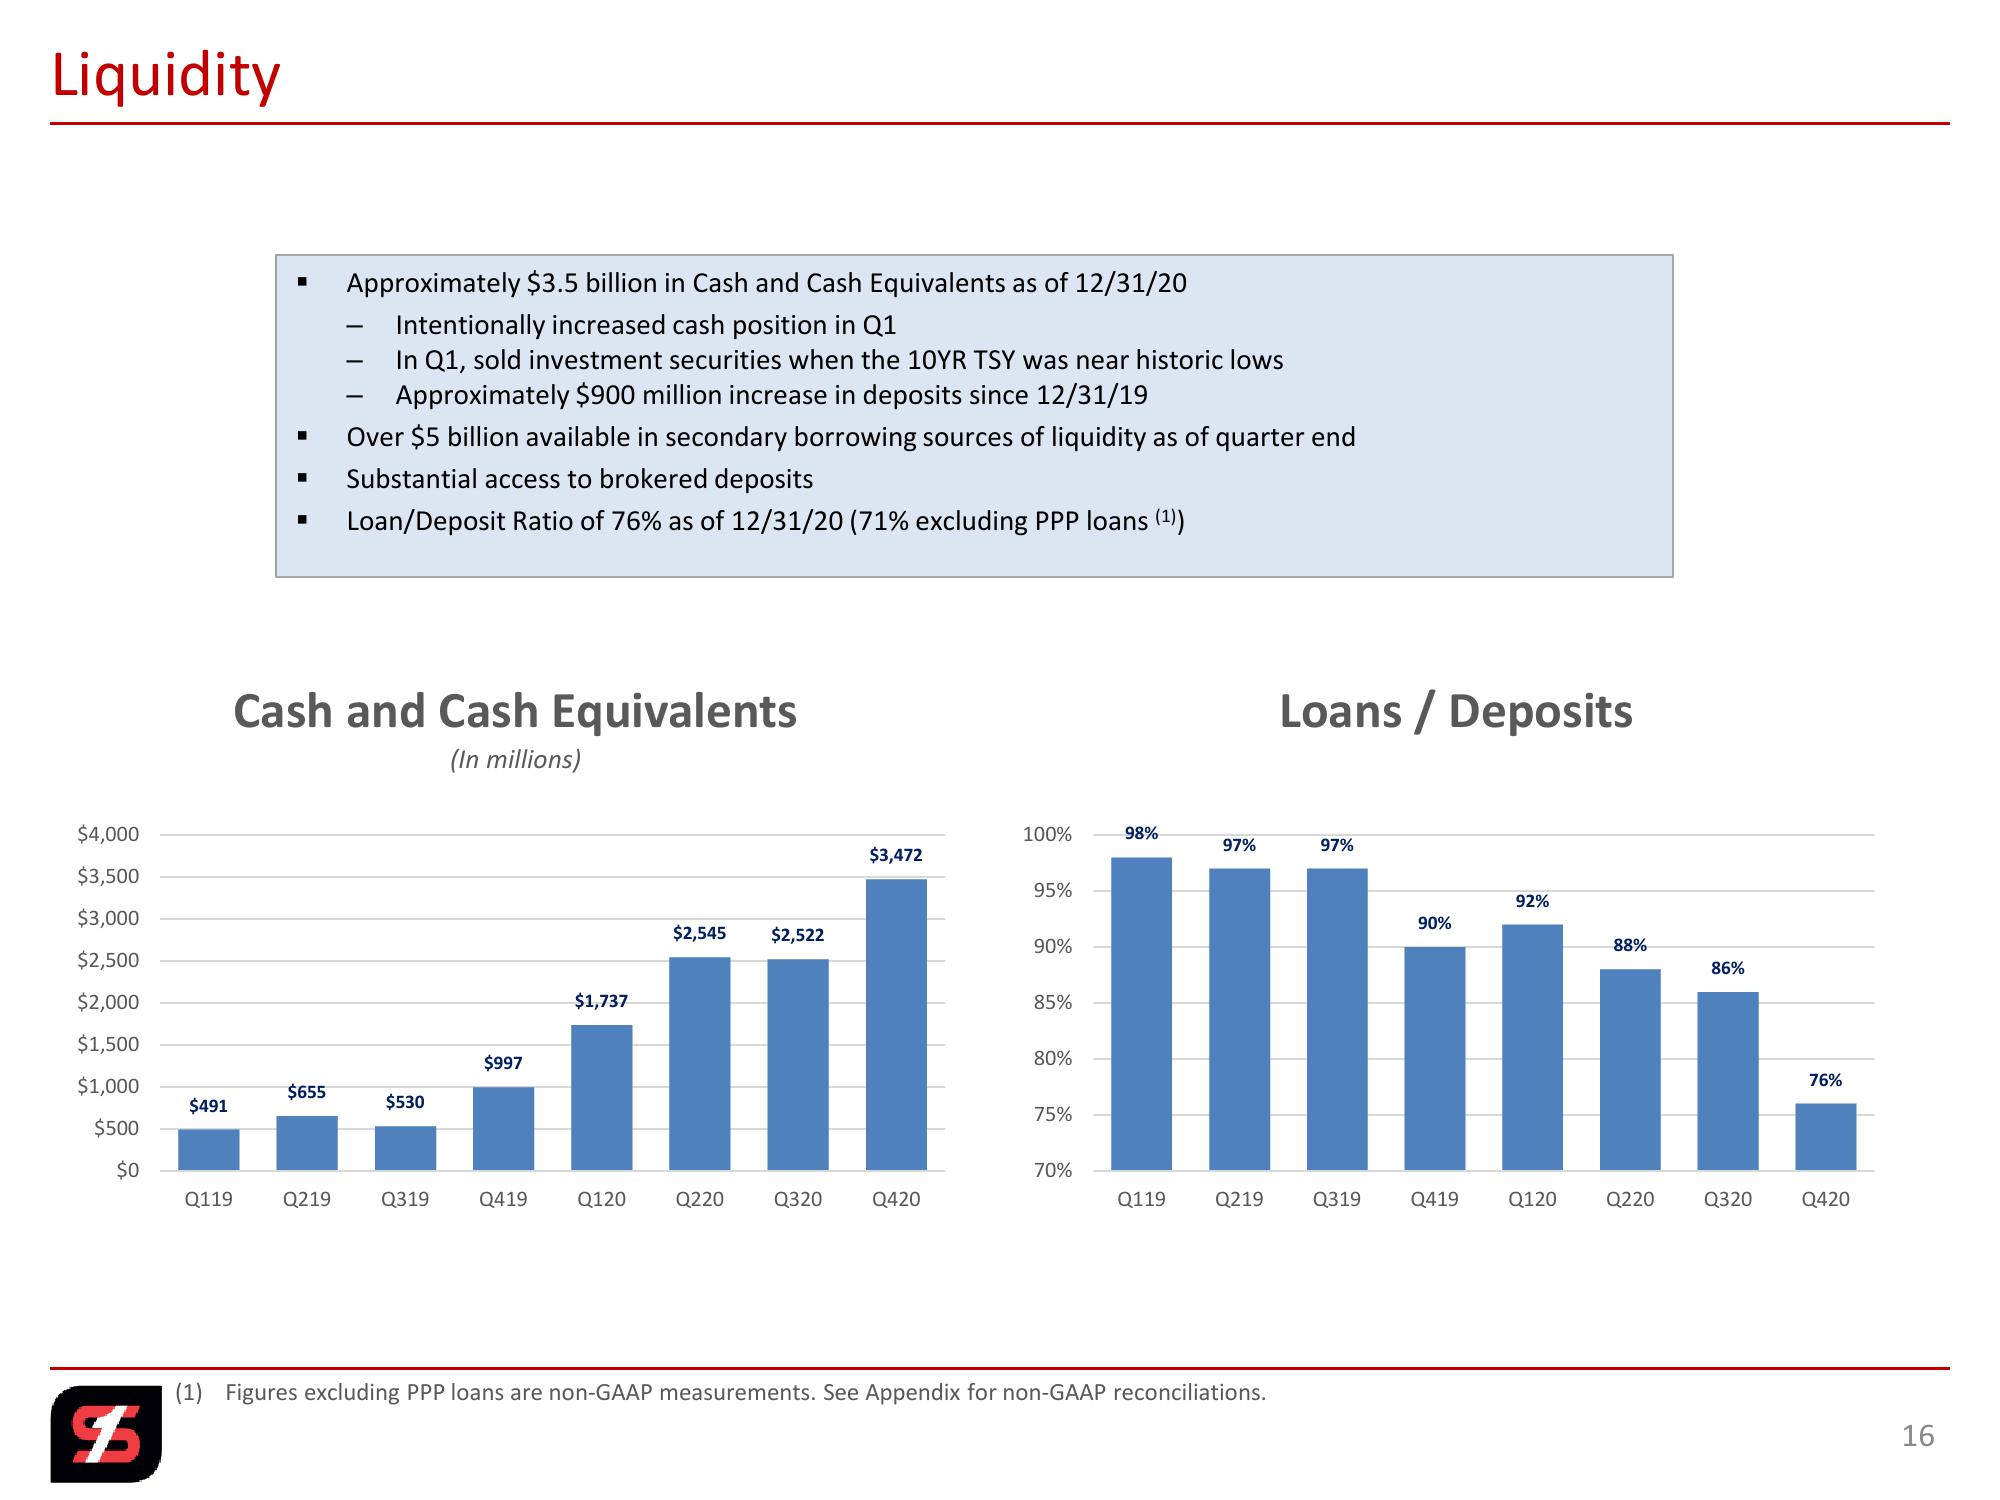
Approximately $3.5 billion in Cash and Cash Equivalents as of 12/31/20
Intentionally increased cash position in Q1
In Q1, sold investment securities when the 10YR TSY was near historic lows
Approximately $900 million increase in deposits since 12/31/19
Over $5 billion available in secondary borrowing sources of liquidity as of quarter end
Substantial access to brokered deposits
Loan/Deposit Ratio of 76% as of 12/31/20 (71% excluding PPP loans (1))
Cash and Cash Equivalents
(In millions)
Loans/Deposits
$4,000
$3,500
$3,000
$2,545
$2,522
$2,500
$2,000
$1,737
100%
98%
97%
97%
$3,472
95%
90%
85%
92%
90%
88%
86%
$1,500
$997
80%
$1,000
76%
$655
$491
$530
75%
$500
$0
70%
Q119
Q219
Q319
Q419
Q120
Q220
Q320
Q420
Q119
Q219
Q319
Q419
Q120
Q220
Q320
Q420
F
(1) Figures excluding PPP loans are non-GAAP measurements. See Appendix for non-GAAP reconciliations.
16View entire presentation