Bird Investor Presentation Deck
Strong Q1 financial results
●
●
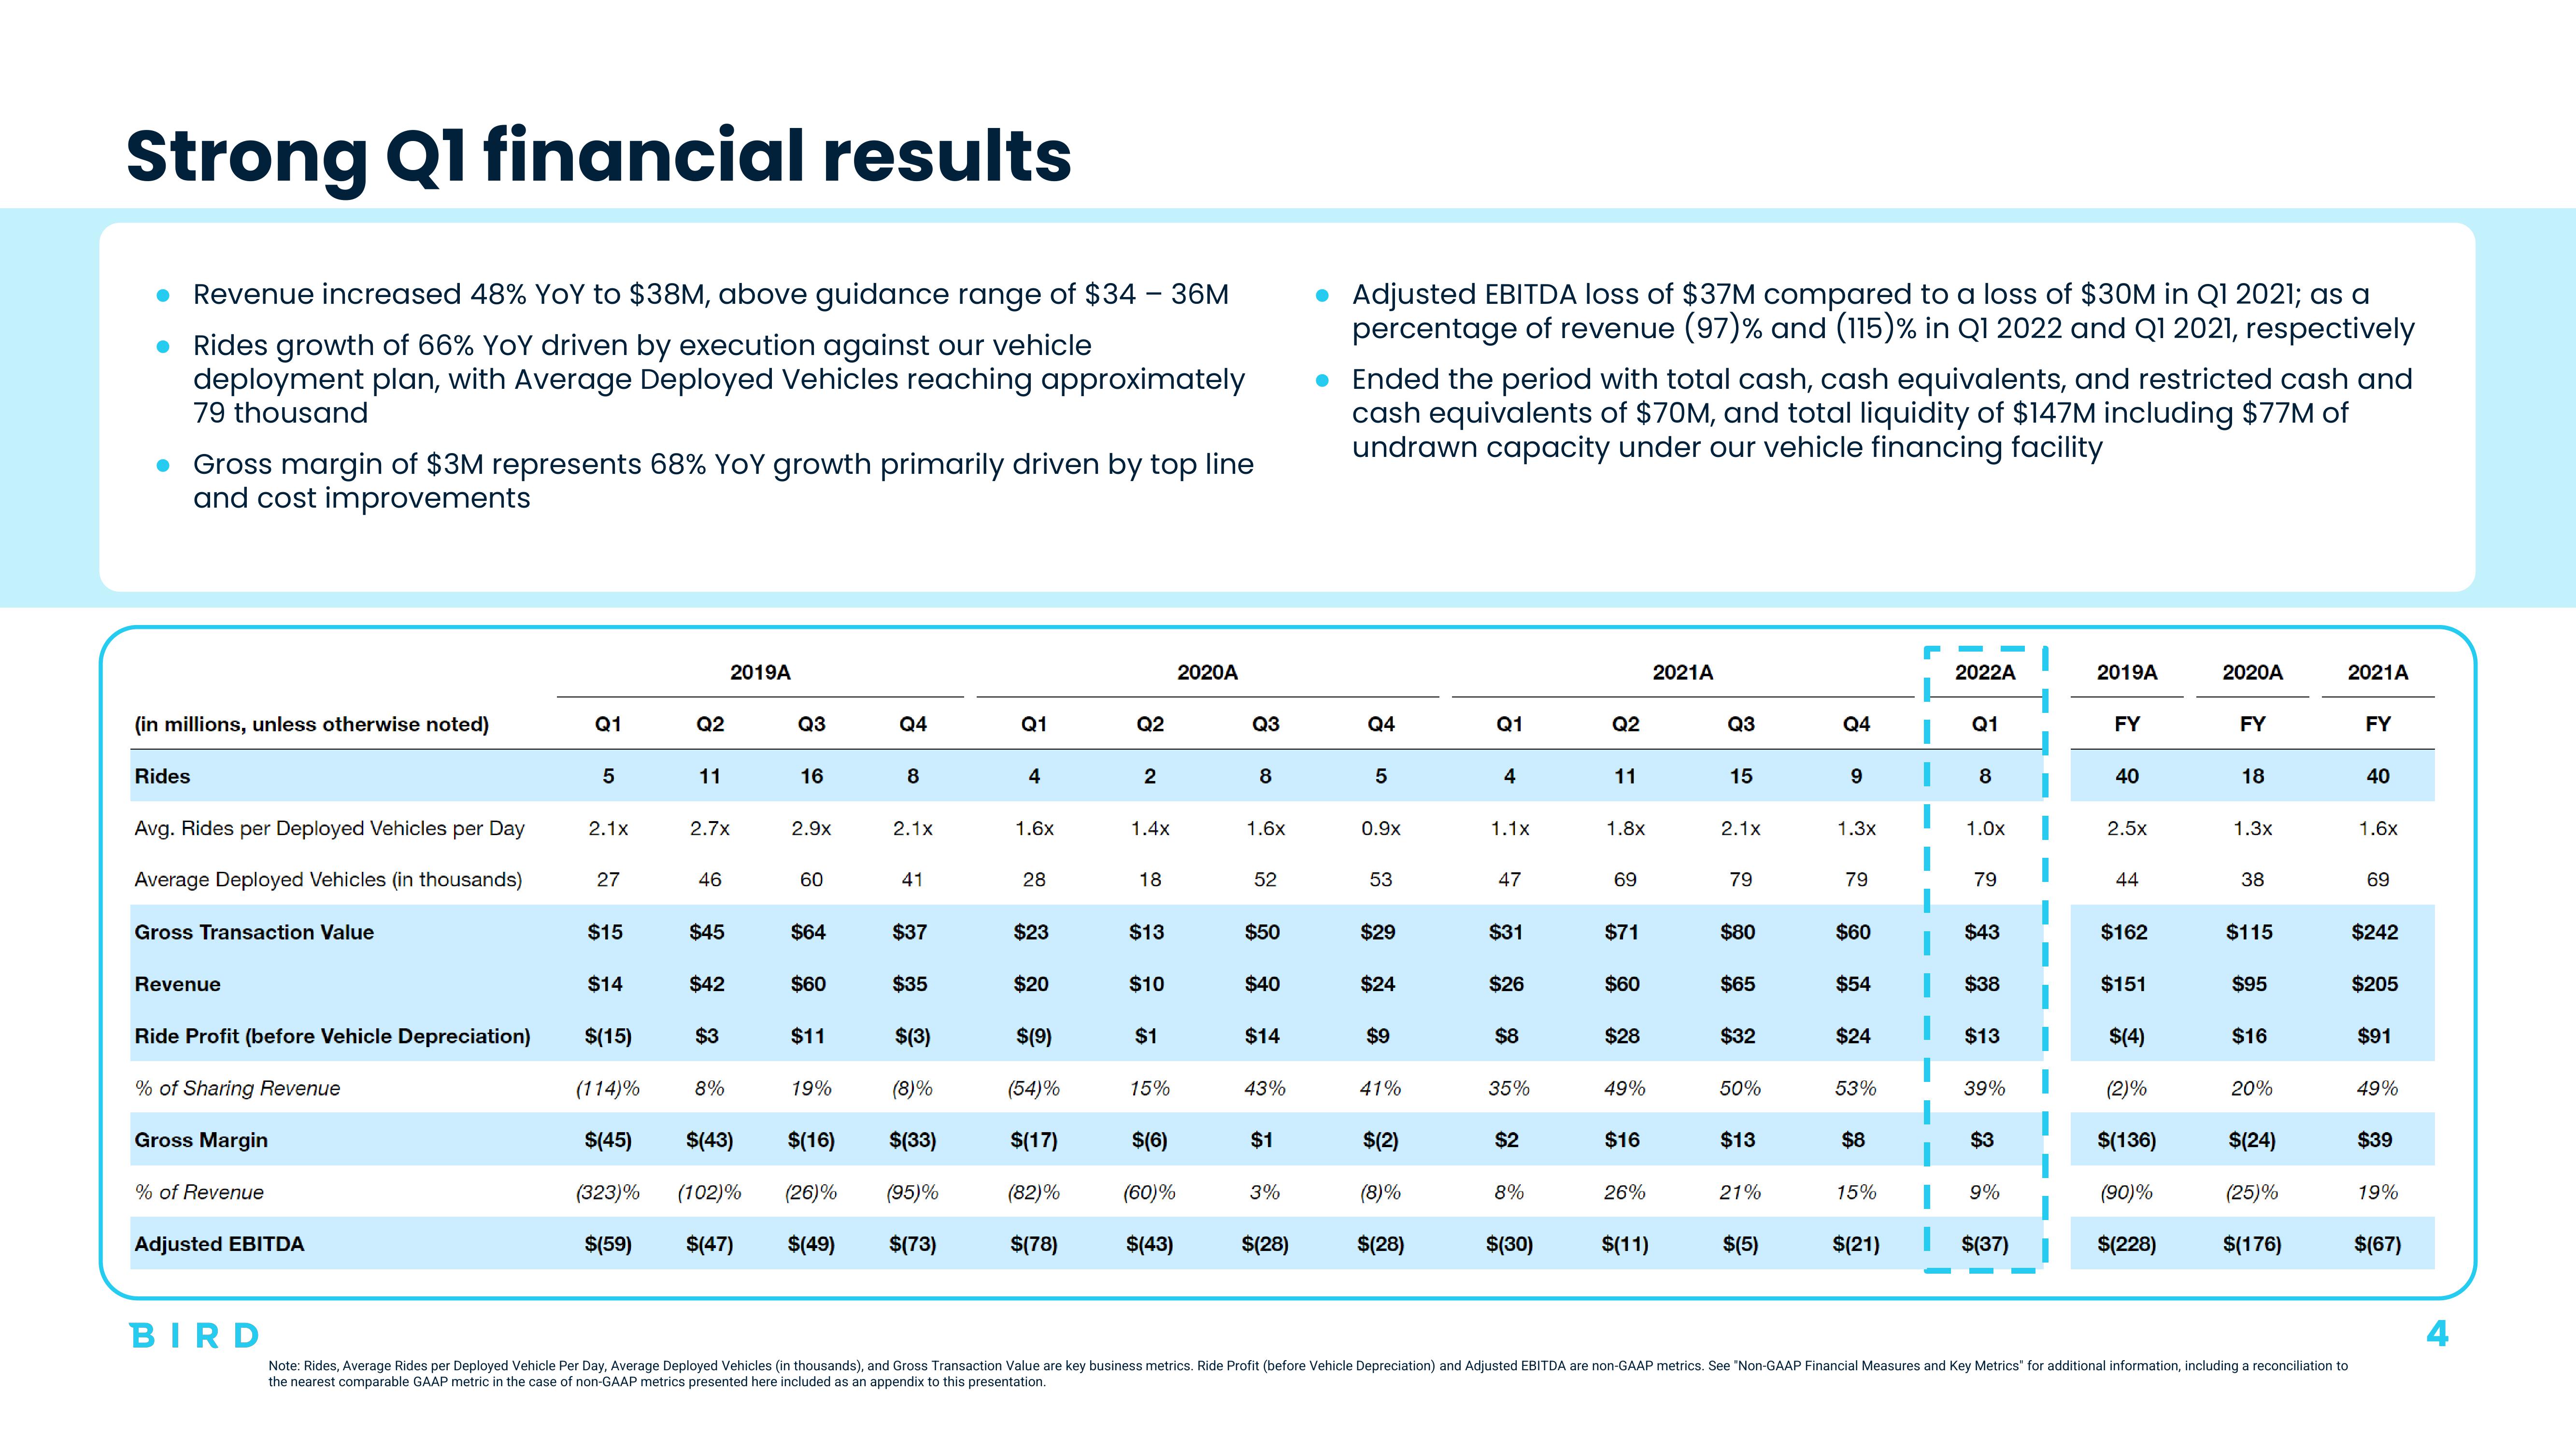
Revenue increased 48% YoY to $38M, above guidance range of $34 - 36M
Rides growth of 66% YoY driven by execution against our vehicle
deployment plan, with Average Deployed Vehicles reaching approximately
79 thousand
● Gross margin of $3M represents 68% YoY growth primarily driven by top line
and cost improvements
(in millions, unless otherwise noted)
Rides
Avg. Rides per Deployed Vehicles per Day
Average Deployed Vehicles (in thousands)
Gross Transaction Value
Revenue
Ride Profit (before Vehicle Depreciation)
% of Sharing Revenue
Gross Margin
% of Revenue
Adjusted EBITDA
BIRD
Q1
5
2.1x
27
$15
$14
$(15)
(114)%
$(45)
(323)%
$(59)
Q2
11
2.7x
46
$45
$42
2019A
$3
8%
Q3
16
2.9x
60
$64
$60
$35
$(3)
(8)%
$(43) $(16) $(33)
(102)% (26)% (95)%
$(47) $(49) $(73)
$11
Q4
19%
8
2.1x
41
$37
Q1
4
1.6x
28
$23
$20
$(9)
(54)%
$(17)
(82)%
$(78)
Q2
2
1.4x
18
$13
$10
$1
15%
$(6)
(60)%
$(43)
2020A
Q3
8
1.6x
52
$50
$40
$14
43%
$1
3%
$(28)
● Adjusted EBITDA loss of $37M compared to a loss of $30M in Q1 2021; as a
percentage of revenue (97)% and (115) % in Q1 2022 and Q1 2021, respectively
• Ended the period with total cash, cash equivalents, and restricted cash and
cash equivalents of $70M, and total liquidity of $147M including $77M of
undrawn capacity under our vehicle financing facility
Q4
5
0.9x
53
$29
$24
$9
41%
$(2)
(8)%
$(28)
Q1
4
1.1x
47
$31
$26
$8
35%
$2
8%
$(30)
Q2
11
1.8x
69
$71
$60
$28
49%
$16
26%
$(11)
2021A
Q3
15
2.1x
79
$80
$65
$32
50%
$13
21%
$(5)
Q4
9
1.3x
79
$60
$54
$24
53%
$8
15%
$(21)
2022A
Q1
8
1.0x
79
$43
$38
$13
39%
$3
9%
$(37)
1
2019A
FY
40
2.5x
44
$162
$151
$(4)
(2)%
$(136)
(90)%
$(228)
2020A
FY
18
1.3x
38
$115
$95
$16
20%
$(24)
(25)%
$(176)
2021A
Note: Rides, Average Rides per Deployed Vehicle Per Day, Average Deployed Vehicles (in thousands), and Gross Transaction Value are key business metrics. Ride Profit (before Vehicle Depreciation) and Adjusted EBITDA are non-GAAP metrics. See "Non-GAAP Financial Measures and Key Metrics" for additional information, including a reconciliation to
the nearest comparable GAAP metric in the case of non-GAAP metrics presented here included as an appendix this presentation.
FY
40
1.6x
69
$242
$205
$91
49%
$39
19%
$(67)
4View entire presentation