Axalta Coating Systems Q2 2017 Financial Results
Q2 Consolidated Results
($ in millions)
Financial Performance
Performance
Transportation
Net Sales
Net Income (Loss) (1
(1)
$1,064
2017
(0.3%)
AXALTA COATING SYSTEMS
Q2
(21)
2016
663
426
1,089 1,064
Adjusted EBITDA
227
251
(9.5%)
(1) Represents Net Income (Loss) attributable to controlling interests
Q2 2016 Volume Price
6.9%
631
5.1%
433 (1.7%) (0.7%)
2.3%
3.8%
51
Net Sales Variance
% Change
Incl. F/X Excl. F/X
(2.4%) (1.5%) +6.5%
+2.3%
$1,089
FX Acq. Q2 2017
5
Commentary
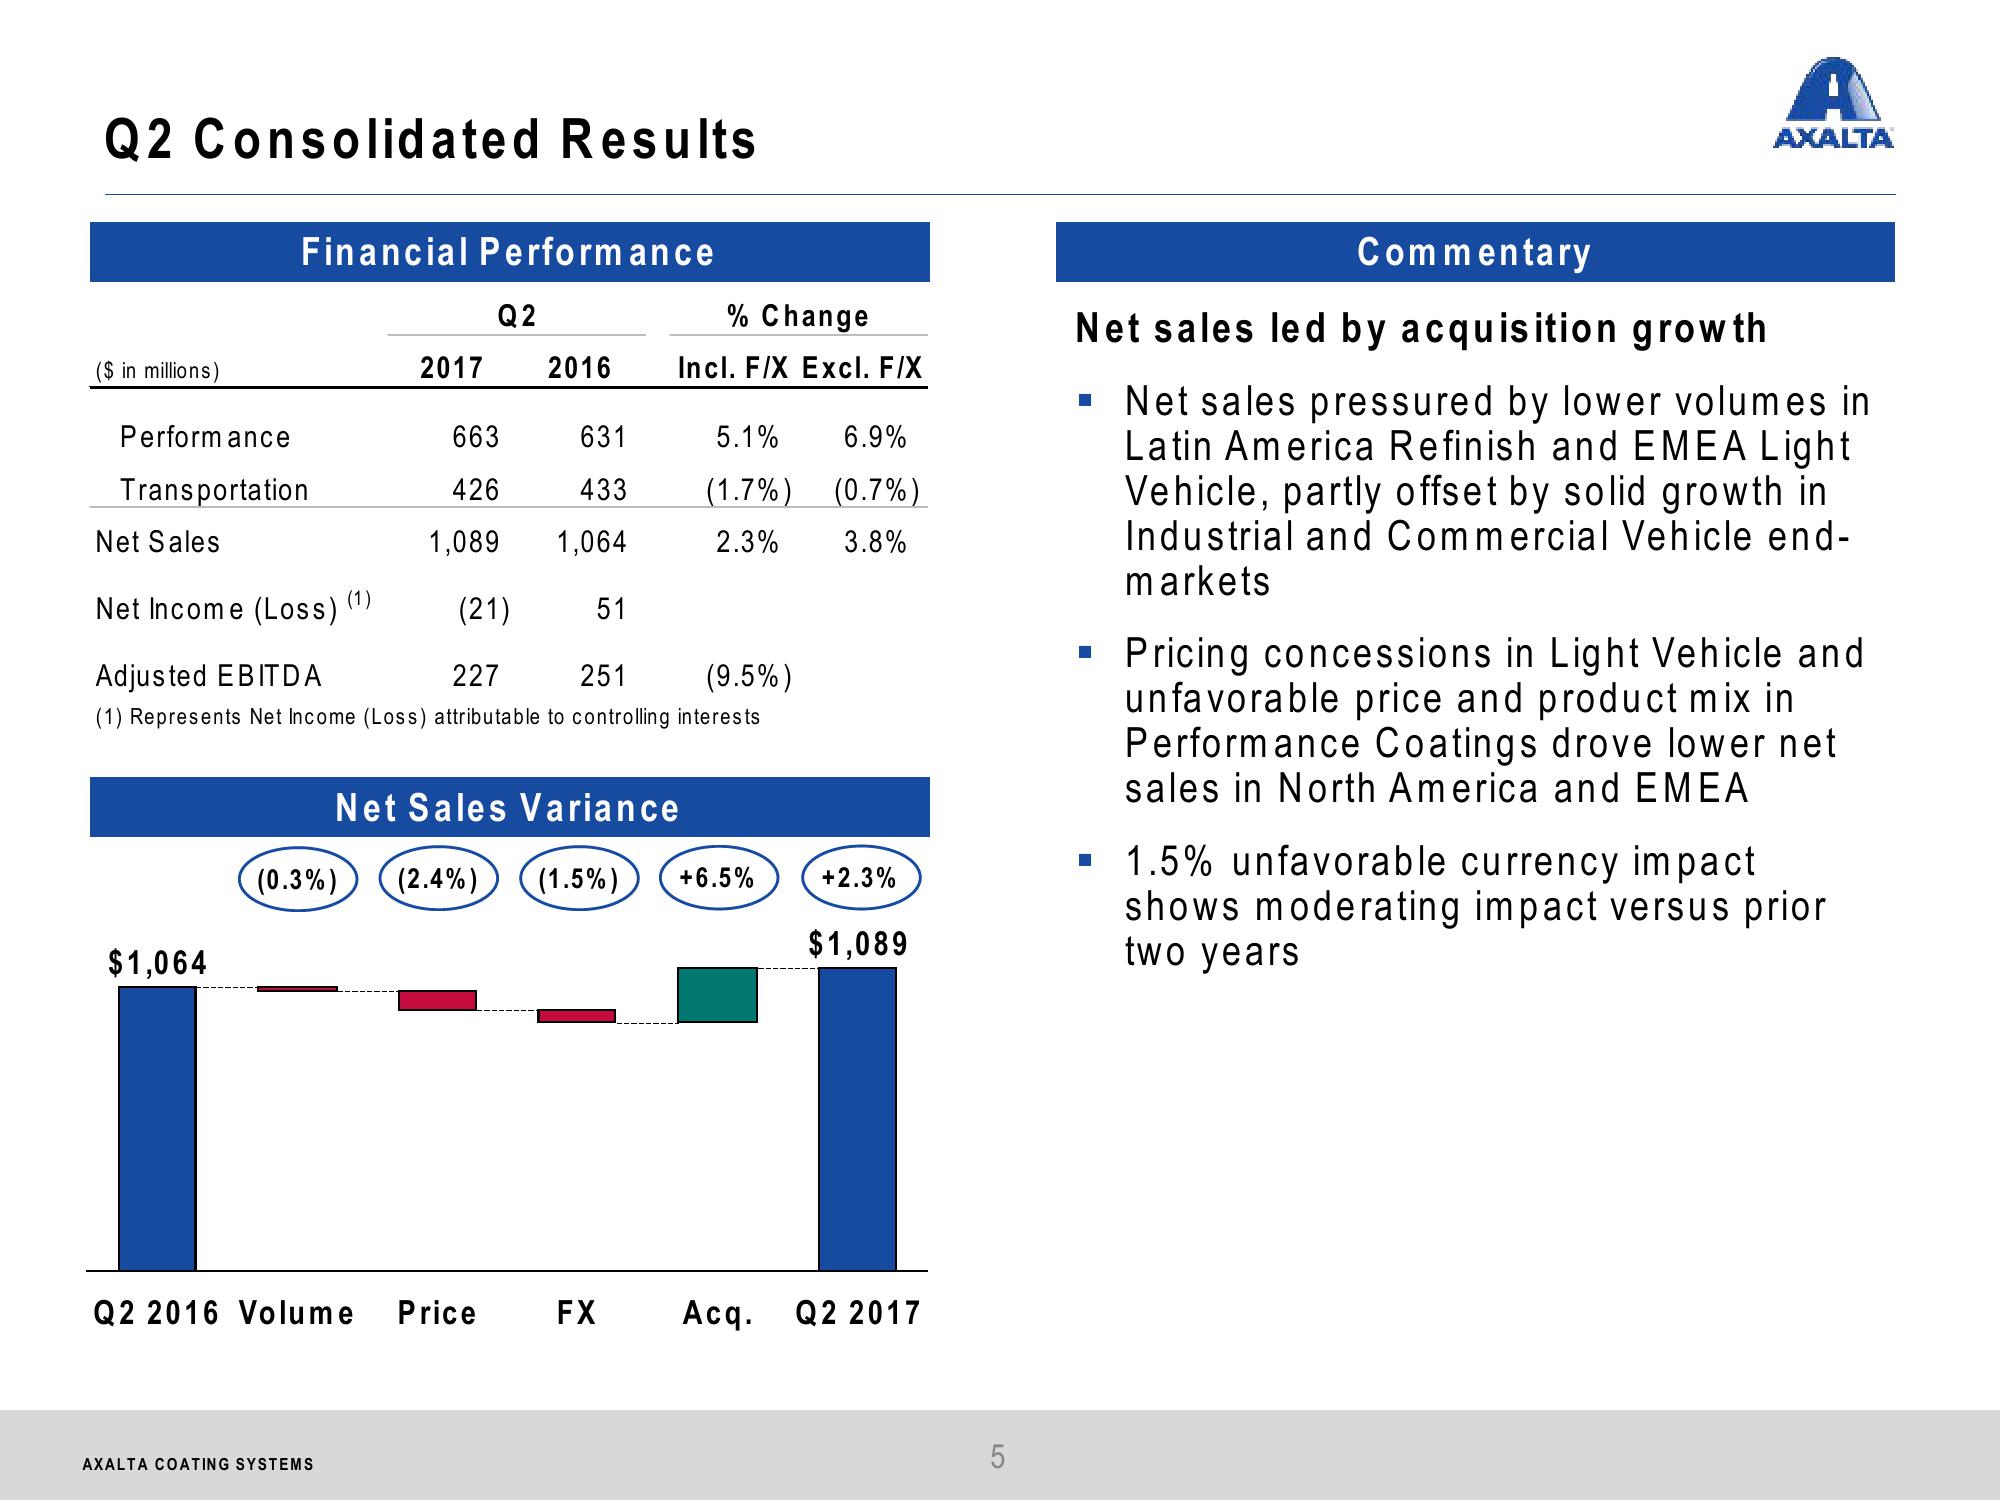
Net sales led by acquisition growth
■ Net sales pressured by lower volumes in
Latin America Refinish and EMEA Light
Vehicle, partly offset by solid growth in
Industrial and Commercial Vehicle end-
markets
■
A
AXALTA
■
Pricing concessions in Light Vehicle and
unfavorable price and product mix in
Performance Coatings drove lower net
sales in North America and EMEA
1.5% unfavorable currency impact
shows moderating impact versus prior
two yearsView entire presentation