Lordstown Motors Results Presentation Deck
Financial
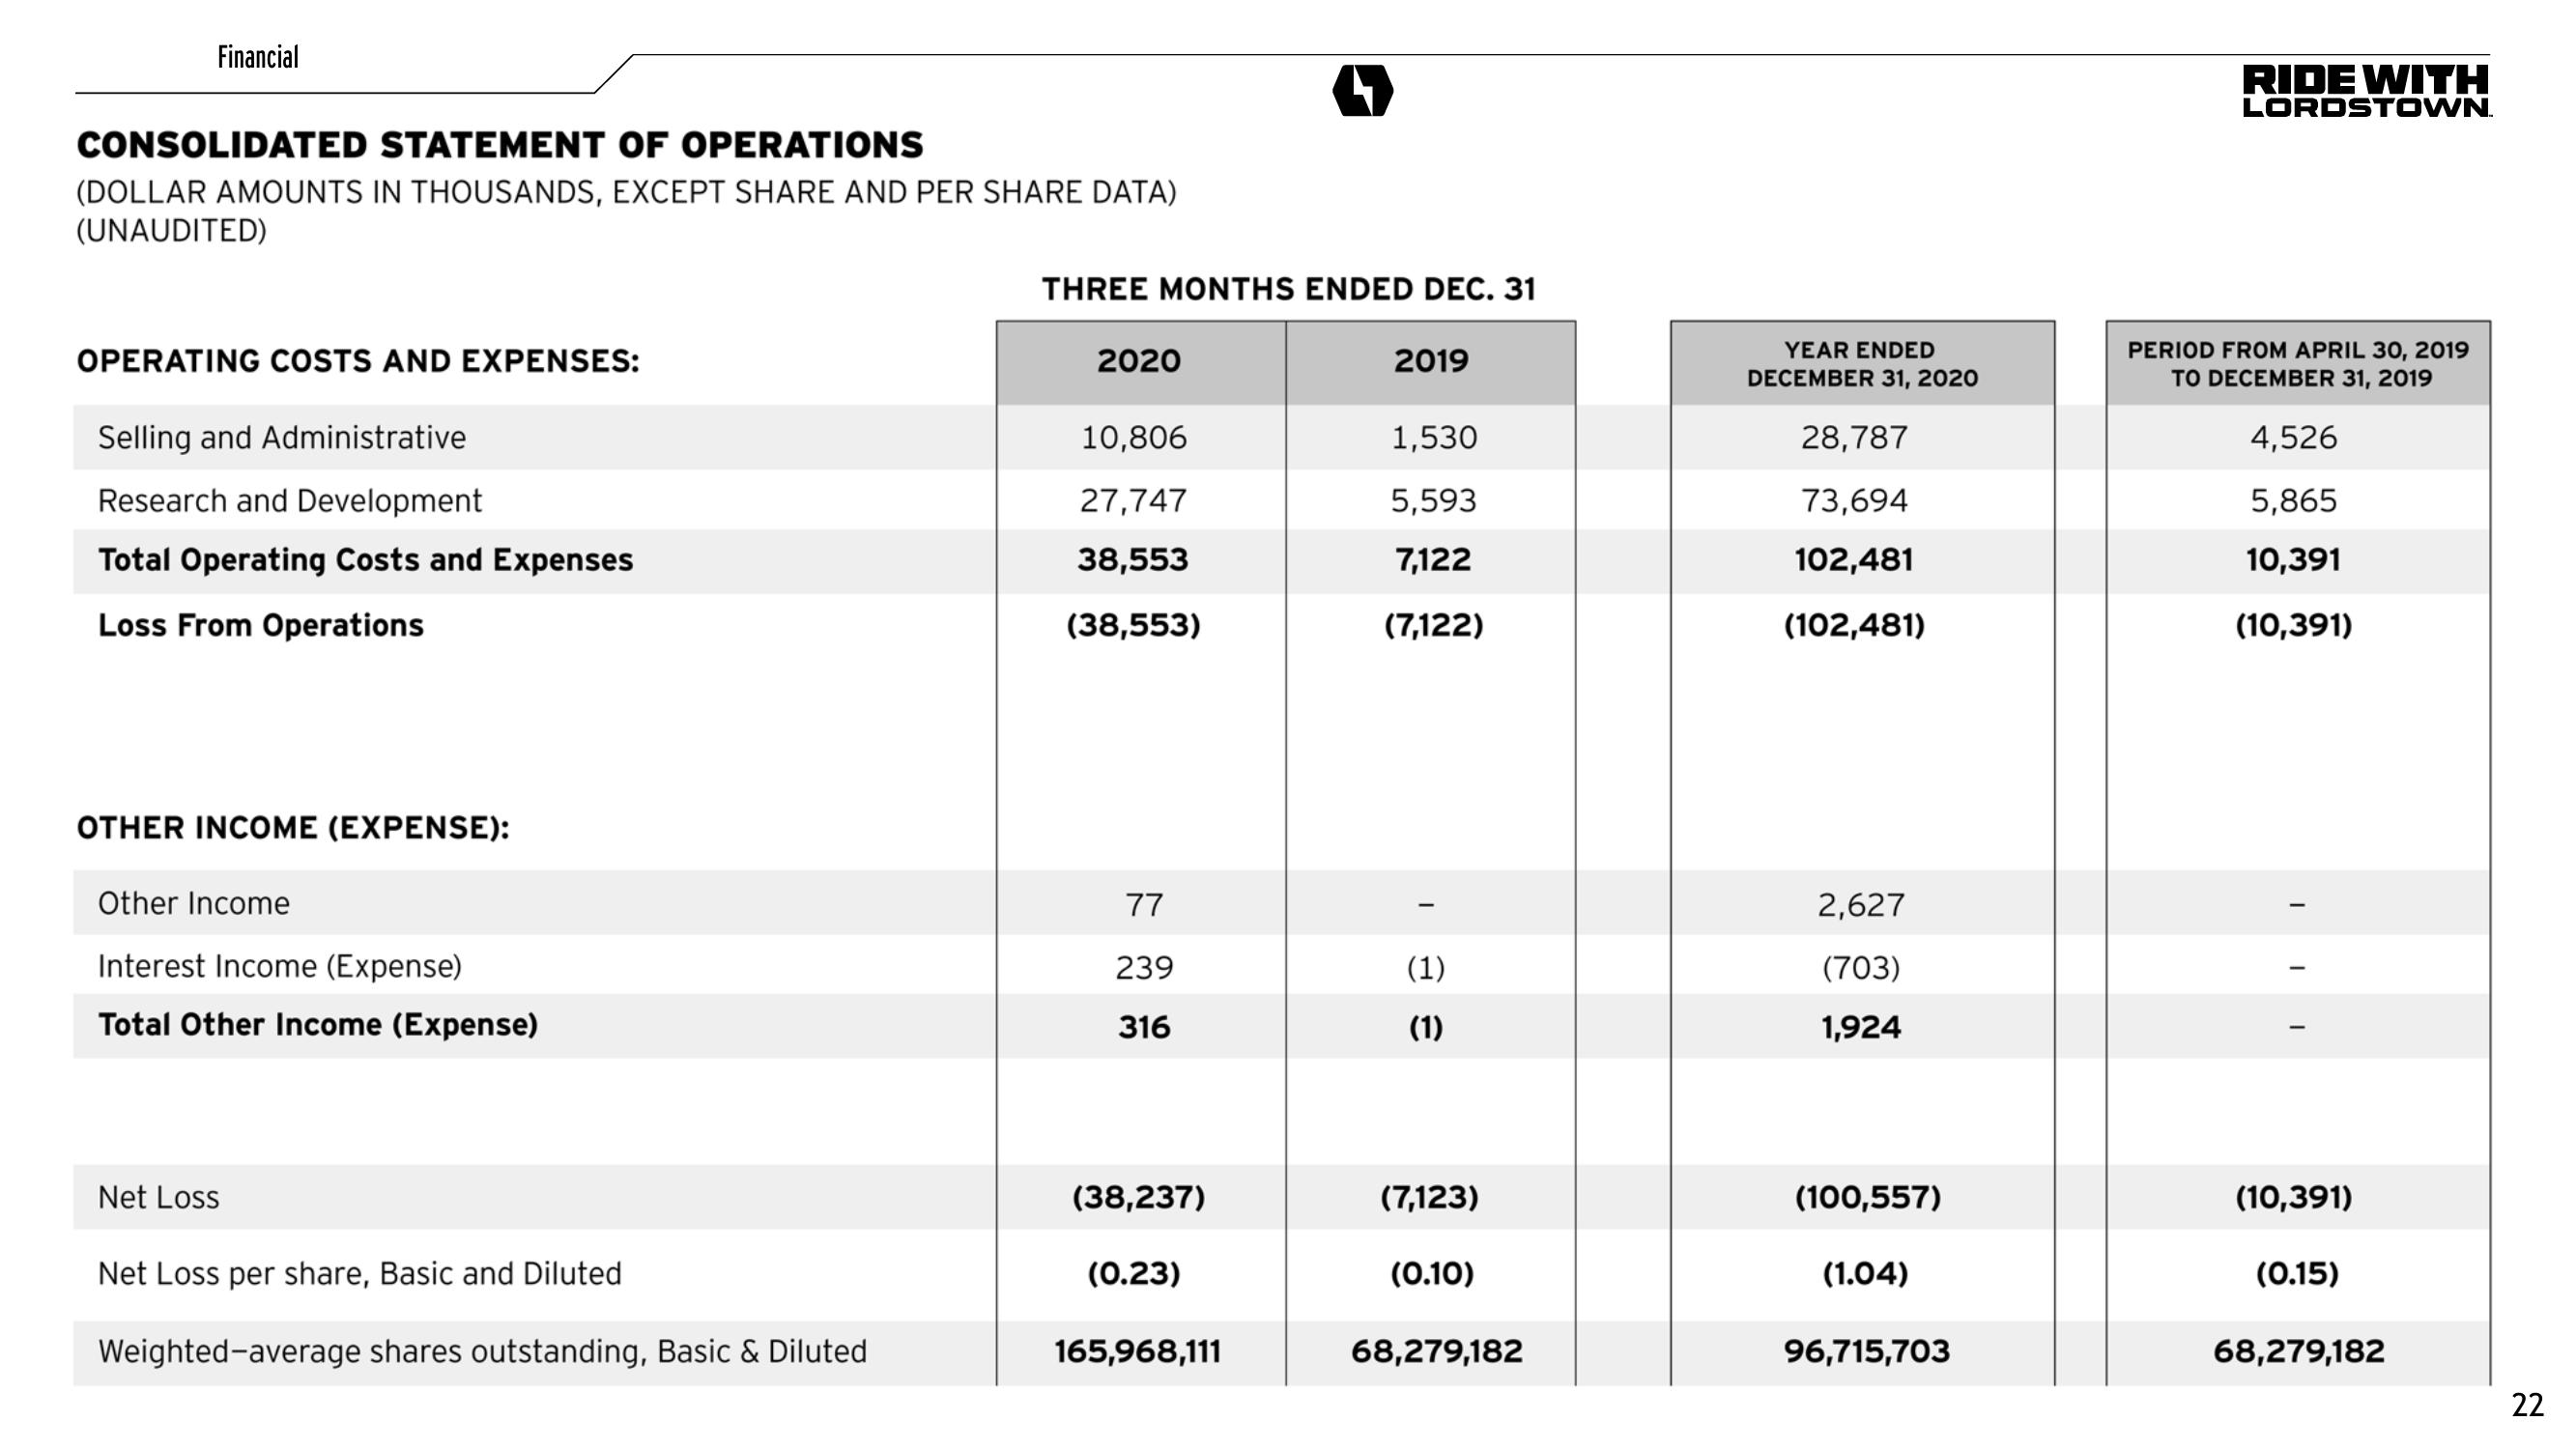
CONSOLIDATED STATEMENT OF OPERATIONS
(DOLLAR AMOUNTS IN THOUSANDS, EXCEPT SHARE AND PER SHARE DATA)
(UNAUDITED)
OPERATING COSTS AND EXPENSES:
Selling and Administrative
Research and Development
Total Operating Costs and Expenses
Loss From Operations
OTHER INCOME (EXPENSE):
Other Income
Interest Income (Expense)
Total Other Income (Expense)
Net Loss
Net Loss per share, Basic and Diluted
Weighted-average shares outstanding, Basic & Diluted
THREE MONTHS ENDED DEC. 31
2020
10,806
27,747
38,553
(38,553)
77
239
316
(38,237)
(0.23)
165,968,111
2019
1,530
5,593
7,122
(7,122)
(1)
(1)
(7,123)
(0.10)
68,279,182
YEAR ENDED
DECEMBER 31, 2020
28,787
73,694
102,481
(102,481)
2,627
(703)
1,924
(100,557)
(1.04)
96,715,703
RIDE WITH
LORDSTOWN.
PERIOD FROM APRIL 30, 2019
TO DECEMBER 31, 2019
4,526
5,865
10,391
(10,391)
(10,391)
(0.15)
68,279,182
22View entire presentation