Disney Results Presentation Deck
Q2 Disney+ Subscribers & ARPU
(Paid Subscribers in Millions and Average Monthly Revenue per Paid Subscriber (ARPU) in USD)
Global ARPU
Disney+ Core
Disney+ Hotstar
Disney + Core Subscribers
87.6
Q2'22
50.1
Q2'22
104.3
Q1'23
Disney+hotstar Subscribers
$4.35
$6.33
$0.76
57.5
Total Disney+ Subscribers(¹) 137.7 161.8
Q1'23
$3.93
$5.77
$0.74
104.9
Note: See DTC Product Descriptions and Key Definitions on page 17
(1) Total may not equal the sum due to rounding
ⒸDisney
Q2'23
52.9
Q2'23
157.8
$4.44
$6.47
$0.59
Q2'23 vs.
Q2'22 Q1'23
+17.3
+0.6
+2.8
+20.1
(4.6)
(4.0)
+$0.09 +$0.51
+$0.14 +$0.70
($0.17) ($0.15)
Disney+ Core
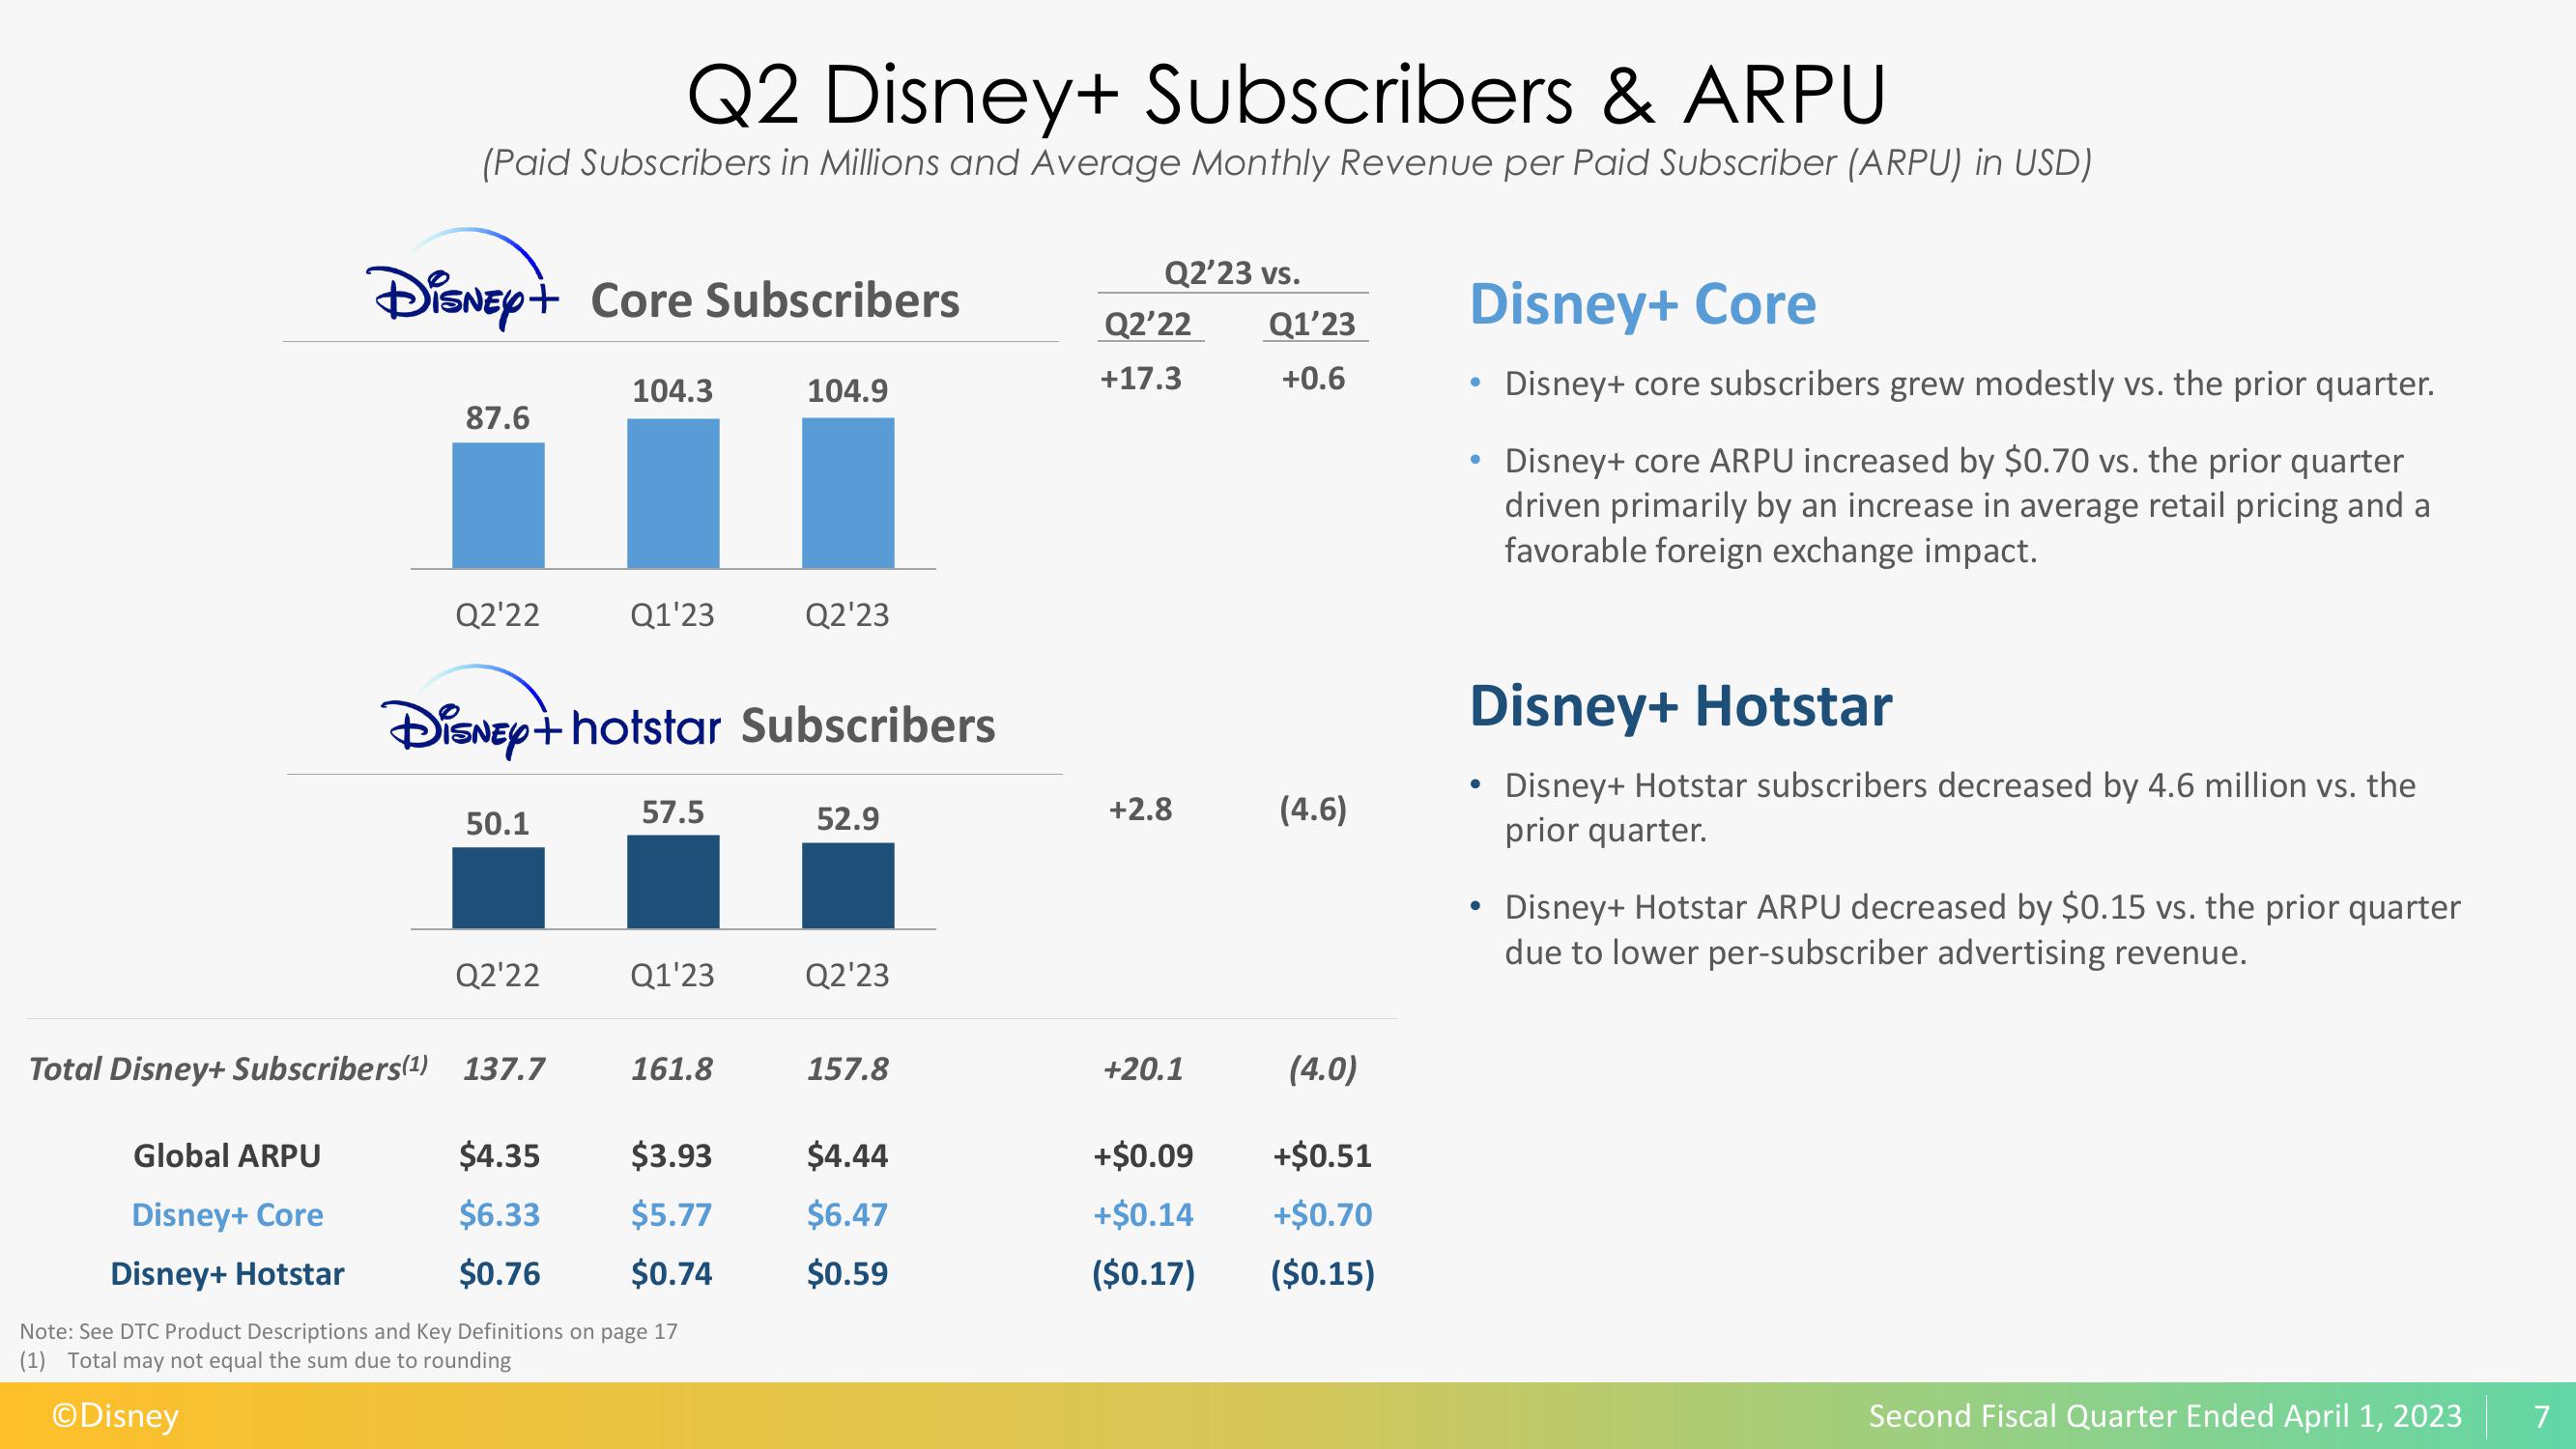
Disney+ core subscribers grew modestly vs. the prior quarter.
●
●
Disney+ core ARPU increased by $0.70 vs. the prior quarter
driven primarily by an increase in average retail pricing and a
favorable foreign exchange impact.
Disney+ Hotstar
• Disney+ Hotstar subscribers decreased by 4.6 million vs. the
prior quarter.
●
Disney+ Hotstar ARPU decreased by $0.15 vs. the prior quarter
due to lower per-subscriber advertising revenue.
Second Fiscal Quarter Ended April 1, 2023
7View entire presentation